1、 Reading data
import pandas
JL_data=pandas.read_excel(io=' route / data source .xlsx')
data=pandas.DataFrame(JL_data)
2、 Write data
1) The ranks of
data=pd.DataFrame(
np.random.randint(low=0,high=6,size=(5,5)),
columns=[' Column 1',' Column 2'],
index=[' That's ok 1',' That's ok 2']
)
2) Column
data=pd.DataFrame({'key1':list('aabba'),
'key2': ['one','two','one','two','one'],
'data1': np.random.randn(5),
'data2': np.random.randn(5)})
1、 Single column :data["lng"]
2、 Multiple columns :
xl = data.iloc[:, 1:] # selection DataFrame All of the line , And intercept the second column to the last column .
df = data.iloc[1:] # selection DataFrame The second line to the last line of , Keep all columns , And save the selected data table in a new variable .
3、 Single value :
data["lng"][0]==data.loc[0,"lng"]
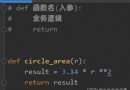
Feature construction based on existing data
1、 Calculation : Addition, subtraction, multiplication and division between two columns
data['new']= Add + reduce - ride * except / remainder % merchant // power **
2、 Define indicators
1) A keyword as an indicator
import re
j=0
for j in range(0,len(data[' Field 1'])):
data['new'][j] = str(re.findall(r' key word ',data[' Field 1'][j])).replace('[','').replace("'",'')
j+=1
data['new']
2) The content after a specific symbol is used as an indicator
(?<= Special symbols ).*$
3) A segment as an indicator
data['new'] = ''
data.loc[data[' Field 1'] - data[' Field 2'] > 0, 'new'] = ' class 1'
data.loc[data[' Field 1'] - data[' Field 2'] <= 0, 'new'] = ' class 2'
data['new'].value_counts()
data['new']
High flexibility , You can customize your analysis and calculation requirements at will
The context is clear and easy to understand the data
Strong operability , Report artifact
1、pivot_table brief introduction
pivot_table(data, values=None, index=None, columns=None,aggfunc='mean', fill_value=None, margins=False, dropna=True, margins_name='All')
pivot_table There are four most important parameters index、values、columns、aggfunc, This article focuses on these four parameters pivot How the operation is carried out .
1)Index:Index Is the hierarchy field , Namely excel Pivot table rows , You can do more , Form multiple dimensions
pd.pivot_table(data,index=[' Field 1']) ,pd.pivot_table(data,index=[' Field 1',' Field 2'])
2)Columns similar Index You can set the column hierarchy field , It is not a required parameter , As an optional way to split data .
pd.pivot_table(df,index=[' Field 1'],columns=[' Field 2'])
3) Values: stay index Indicators under the field dimension , Fields that can only be numeric
pd.pivot_table(data,index=[' Field 1',' Field 2']],values=[' indicators 1',' indicators 2',' indicators 3'])
4)Aggfunc Parameters can be used to set the function operation when we aggregate data .
When we do not set aggfunc when , It defaults to aggfunc='mean' Calculate the mean :
pd.pivot_table(df,index=[' Field 1',' Field 2']],values=[' indicators 1',' indicators 2',' indicators 3'],aggfunc=[np.sum,np.mean])
There's more :min、sum、max、count、mean、median etc.
5)fill_value By default, null values are filled , can fill_value=0,margins=True\margins=1 To summarize
6) type
aggfunc You can also use dict type , If dict Content and content in values When you don't match , With dict Whichever comes first .
Pandas Zhongba dataframe Turn into array:df=df.values
2、groupby
1) polymerization
data.groupby(' Field '),data.groupby([' Field 1'],[' Field 2'])
Aggregate value :data.groupby([' Field 1'],[' Field 2'])[' indicators 1'].transform('sum')
data=groupby([' Field 1'],[' Field 2'])[' indicators 1',' indicators 2'].sum().sort_values([' Field 1'],[' Field 2']],ascending=False).reset_index()
2) grouping , Group by Dictionary
mapping = {' Field 1':' class 1',' Field 2':' class 1',' Field 3':' class 2'}
data = people.groupby(mapping,axis=1).mean()
Save the processing results to excel in
data.to_excel(r' route / data structure .xlsx')