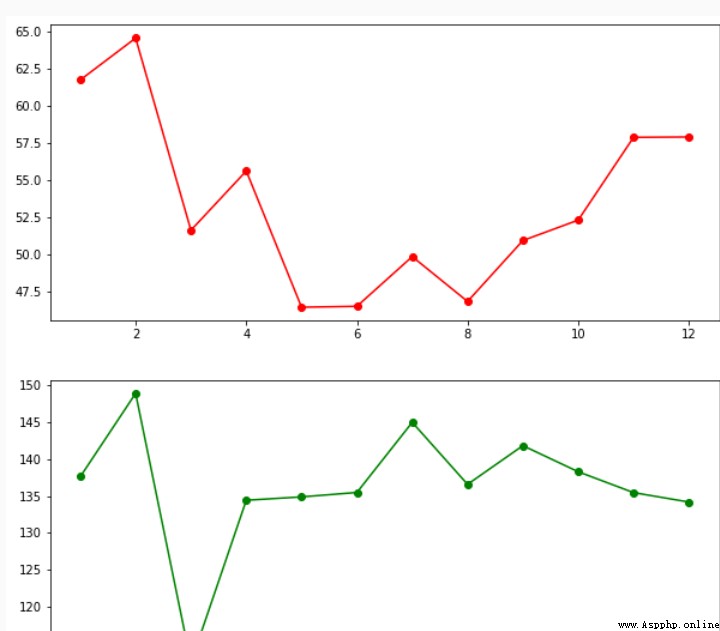
About using pandas\time\matplotlib The library will Intel and IBM The average value of the opening price of each month of the company in the past year is drawn in a chart ( use subplot or subplots() function )

import pandas as pd
import matplotlib.pyplot as plt
import time
def create_aveg_open(stock_code):
quotesdf_ori=pd.read_csv('step1/'+stock_code+'.csv',index_col=[0])
# Please add the code here , Complete the output as required
meanopen=quotesdf_ori.groupby('month').open.mean()return meanopen def plot():
open1 = create_aveg_open('INTC')
open2 = create_aveg_open('IBM')
plt.figure(figsize=(10,10),dpi=100)
# Please add the code here , Complete the output as required
x1=open1.indexy1=open1x2=open2.indexy2=open2plt.subplpt(211)plt.plot(x1,y1,color="r",marker="o")plt.subplpt(212)plt.plot(x1,y1,color="g",marker="o")plt.show()plt.savefig( 'step1/outfile/sub.png' )plt.close()Do not know, such as grouping month
Ability to display line charts grouped by month