Catalog
sklearn Chinese document 1.17. Neural network model ( Supervised ) - sklearnhttps://www.scikitlearn.com.cn/0.21.3/18/ #sklearn%E4%B8%AD%E6%96%87%E6%96%87%E6%A1%A3%C2%A01.17.%20%E7%A5%9E%E7%BB%8F%E7%BD%91%E7%BB%9C%E6%A8%A1%E5%9E%8B%EF%BC%88%E6%9C%89%E7%9B%91%E7%9D%A3%EF%BC%89%20-%20sklearnhttps%3A%2F%2Fwww.scikitlearn.com.cn%2F0.21.3%2F18%2F
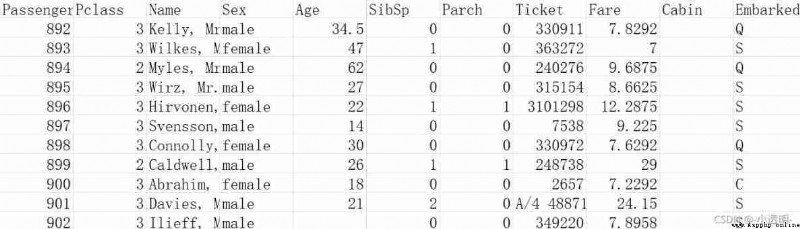
“ Titanic ” Data set profile
train.csv
test.csv
Data import
Fill in missing values
Mapping character quantities to numeric quantities
Use regression algorithm to predict
Linear regression :
Logistic regression classification :
Test its accuracy with the test set
Use random forest improvement model
Importance analysis of random forest characteristics
The integration algorithm
 https://www.scikitlearn.com.cn/0.21.3/18/
This example uses two data sets :train.csv and test.csv, I uploaded them to My resources It's inside .
This data set is based on the escape of passengers on the Titanic , Like in the movie , There was an accident on the Titanic , Some information about the passengers on board is recorded in this form . Now based on this data forecast This man Can you be saved . share 891 Samples . This is a Training set .
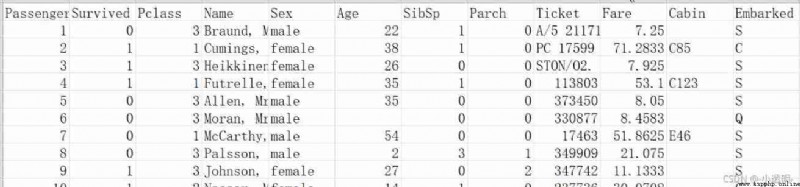
The first row is the characteristic attribute of the data , The meaning is as follows :
Passenger: Number ( General numbering is meaningless )
Survived: It means whether they were rescued (0 It means no rescue ,1 It means being rescued )
Pclass: Position level ( High warehouse level may be rich , Probably The probability of being saved is high ) But I don't know 3 It means high or 1
Sex: Passenger gender ( The lifeboat has a time limit , Probably Will let the women and children go first )
Age: Passenger age ( The lifeboat has a time limit , Older people Probably The probability of being rescued is low )
SibSp: The number of relatives of the passenger ( Probably The more relatives , The greater the chance of being rescued )
Parch:parent and child( There are many old people and children , The passenger takes care of a lot , Probably The chance of being rescued is reduced )
Ticket: The number of the ticket
Fare: Boat fare ( The more expensive the fare Probably Be rescued first )
Cabin: cabin , And there are many missing values ( Generally, it is omitted )
Embarked: Boarding station
Because only be rescued and Not rescued Two cases , So this is a Two classification problem .
import pandas
# Read in the data
titanic = pandas.read_csv("E:/data/my_data/Titanic/train.csv")
# View the number of each column of data 、 mean value 、 Standard deviation 、 Minimum 、 Maximum value and other indicators
print(titanic.describe())
Age There is no total 891 individual , It indicates that there is missing data , It is inconvenient to construct a matrix or operate , Therefore need Fill in missing values .
If the column has too many missing values , Then round off this column ; Otherwise, complete
# Fill in the default values with the mean age
titanic['Age']=titanic["Age"].fillna(titanic["Age"].median())
print(titanic.describe())
PassengerId Survived Pclass Age SibSp \ count 891.000000 891.000000 891.000000 891.000000 891.000000 mean 446.000000 0.383838 2.308642 29.361582 0.523008 std 257.353842 0.486592 0.836071 13.019697 1.102743 min 1.000000 0.000000 1.000000 0.420000 0.000000 25% 223.500000 0.000000 2.000000 22.000000 0.000000 50% 446.000000 0.000000 3.000000 28.000000 0.000000 75% 668.500000 1.000000 3.000000 35.000000 1.000000 max 891.000000 1.000000 3.000000 80.000000 8.000000 Parch Fare count 891.000000 891.000000 mean 0.381594 32.204208 std 0.806057 49.693429 min 0.000000 0.000000 25% 0.000000 7.910400 50% 0.000000 14.454200 75% 0.000000 31.000000 max 6.000000 512.329200
Because the computer doesn't know the meaning of words , So it needs to be converted into numerical value
such as age The quantity of a feature is a character , take male use 0 Express ,female use 1 Express
# take male And female Convert to numeric representation
print(titanic['Sex'].unique())# see sex There are several different characters
titanic.loc[titanic['Sex']=='male','Sex']=0
titanic.loc[titanic['Sex']=='female','Sex']=1
# take embarked It can also be converted to numerical value
print(titanic['Embarked'].unique())
# S Most of them , Therefore, it is speculated that the blank value is S Most likely , So fill in S
titanic['Embarked']==titanic['Embarked'].fillna('S',inplace=True)
titanic.loc[titanic['Embarked']=='S','Embarked']=0
titanic.loc[titanic['Embarked']=='C','Embarked']=1
titanic.loc[titanic['Embarked']=='Q','Embarked']=2
['male' 'female'] [0 1 2]
Check for missing values in the required data :False Indicates that there are no missing values
print(titanic.isnull().any())PassengerId False Survived False Pclass False Name False Sex False Age False SibSp False Parch False Ticket False Fare False Cabin True Embarked False dtype: bool
from sklearn.linear_model import LinearRegression
# Linear regression
from sklearn.model_selection import KFold
# Cross validation
predictors = ["Pclass","Sex","Age","SibSp","Parch","Fare","Embarked"]
# initialization Regression algorithm
alg = LinearRegression()
# Divide the samples equally 3 Share ,3 Secondary cross validation
kf = KFold(n_splits=3,shuffle=True,random_state=1)
predictions = []# Finally, average the numbers in the list
for train,test in kf.split(titanic):
#The predictors we're using to train the algorithm. Note how we only take then rows in the train folds.
train_predictors = (titanic[predictors].iloc[train,:])# Get the data of the training set
#The target we're using to train the algorithm.
train_target = titanic["Survived"].iloc[train]# label
#Training the algorithm using the predictors and target.
alg.fit(train_predictors,train_target)# fitting fit
#We can now make predictions on the test fold
test_predictions = alg.predict(titanic[predictors].iloc[test,:])
predictions.append(test_predictions)
import numpy as np
predictions = np.concatenate(predictions,axis=0)# Array splicing ,axis=0 Line by line stitching
predictions[predictions>.5] = 1# >0.5 It means being rescued
predictions[predictions<=.5] = 0
accuracy=sum(predictions==titanic["Survived"])/len(predictions)
print(accuracy)0.5342312008978676
The accuracy is too low !
from sklearn import model_selection
from sklearn.linear_model import LogisticRegression
alg = LogisticRegression(random_state=1)
scores = model_selection.cross_val_score(alg,titanic[predictors],titanic["Survived"],cv=3)
print(scores.mean())
0.7957351290684623
titanic_test=pandas.read_csv("E:/data/my_data/Titanic/test.csv")
titanic_test["Age"]=titanic_test["Age"].fillna(titanic["Age"].median())
titanic_test["Fare"]=titanic_test["Fare"].fillna(titanic["Fare"].median())
titanic_test.loc[titanic_test['Sex']=='male','Sex']=0
titanic_test.loc[titanic_test['Sex']=='female','Sex']=1
titanic_test['Embarked']==titanic_test['Embarked'].fillna('S',inplace=True)
titanic_test.loc[titanic_test['Embarked']=='S','Embarked']=0
titanic_test.loc[titanic_test['Embarked']=='C','Embarked']=1
titanic_test.loc[titanic_test['Embarked']=='Q','Embarked']=2
alg = LogisticRegression(random_state=1)
scores = model_selection.cross_val_score(alg,titanic[predictors],titanic["Survived"],cv=3)
print(scores.mean())
0.7957351290684623
The result is better , But for such a binary classification problem , The accuracy is still too low
When you don't know what to use as a classifier , Random forest is preferred , The effect may be a little better .
from sklearn import model_selection
from sklearn.ensemble import RandomForestClassifier
alg = RandomForestClassifier(random_state=1,n_estimators=10,min_samples_split=2,min_samples_leaf=1)# n_estimator:10 tree ,min_samples_split: Minimum syncopation point min_samples_leaf: Minimum number of leaf nodes
kf = KFold(n_splits=3,shuffle=True,random_state=1)
scores = model_selection.cross_val_score(alg,titanic[predictors],titanic["Survived"],cv=kf)
print(scores.mean())
0.7957351290684626
Adjust the parameters ( The number of trees , The height of the tree should not be too high ), Optimize
Parameter tuning takes the most time .
alg = RandomForestClassifier(random_state=1,n_estimators=50,min_samples_split=4,min_samples_leaf=2)
kf = KFold(n_splits=3,shuffle=True,random_state=1)
scores = model_selection.cross_val_score(alg,titanic[predictors],titanic["Survived"],cv=kf)
print(scores.mean())
0.8260381593714926
If you want more accuracy , It is no longer feasible to modify parameters .
Need to go back to the data again : Identify new features of impact ( Number of families and The appellation of a person's name ( Check it out ))
# Create a new set of features : Number of families ( Brothers and sisters + Parents )
titanic["FamilySize"]=titanic["SibSp"]+titanic["Parch"]
# Sort by name length into a list of new features
titanic["NameLength"]=titanic["Name"].apply(lambda x:len(x))
import re
def get_title(name):
title_search=re.search('([A-Za-z]+)\.',name)
if title_search:
return title_search.group(1)
return ""
titles=titanic["Name"].apply(get_title)
print(pandas.value_counts(titles))
title_mapping={"Mr":1,"Miss":2,"Mrs":3,"Master":4,"Dr":5,"Rev":6,"Major":7,"Col":7,"Mlle":8,"Mme":8,"Don":9,"Lady":9,"Ms":10,"Countess":11,"Capt":12,"Sir":13,"Jonkheer":14}
for k,v in title_mapping.items():
titles[titles==k]=v
print(pandas.value_counts(titles))
titanic["Title"]=titlesMr 517 Miss 182 Mrs 125 Master 40 Dr 7 Rev 6 Mlle 2 Major 2 Col 2 Countess 1 Capt 1 Ms 1 Sir 1 Lady 1 Mme 1 Don 1 Jonkheer 1 Name: Name, dtype: int64 1 517 2 182 3 125 4 40 5 7 6 6 7 4 8 3 9 2 10 1 13 1 12 1 11 1 14 1 Name: Name, dtype: int64
If the error rate of modeling after an original feature is destroyed is similar to that before it is destroyed, it means , The original feature is not so important , conversely , The explanation is important .
import numpy as np
from sklearn.feature_selection import SelectKBest,f_classif# Choose the most important feature
import matplotlib.pyplot as plt
# Candidate features
predictors=["Pclass","Sex","Age","SibSp","Parch","Fare","Embarked","FamilySize","Title","NameLength"]
selector = SelectKBest(f_classif,k=5)
selector.fit(titanic[predictors],titanic["Survived"])
scores=-np.log10(selector.pvalues_)
plt.bar(range(len(predictors)),scores)
plt.xticks(range(len(predictors)),predictors,rotation="vertical")
plt.show()
predictors=["Pclass","Sex","Fare","Title"]
alg = RandomForestClassifier(random_state=1,n_estimators=50,min_samples_split=8,min_samples_leaf=4)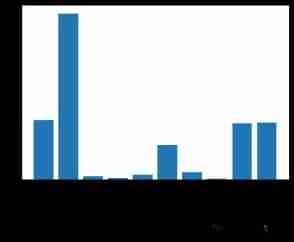
It can be seen from the picture that , The higher the column is , The greater the impact ( It turns out that it has something to do with the length of the name ( This is easy to ignore ))
Regardless of time and space , Only consider the result , Multiple classifiers can be combined to get better results
from sklearn.ensemble import GradientBoostingClassifier
import numpy as np
algorithms=[
# The characteristic column can be modified , The result will be different after modification
[GradientBoostingClassifier(random_state=1,n_estimators=25,max_depth=3),["Pclass","Sex","Fare","Title","NameLength"]],
[LogisticRegression(random_state=1),["Pclass","Sex","Fare","Title","NameLength"]]
]
kf = KFold(n_splits=3,shuffle=True,random_state=1)
predictions = []
for train,test in kf.split(titanic):
#The target we're using to train the algorithm.
train_target = titanic["Survived"].iloc[train]
full_test_predictions=[]
for alg,predictors in algorithms:
alg.fit(titanic[predictors].iloc[train,:],train_target)
#We can now make predictions on the test fold
test_predictions = alg.predict_proba(titanic[predictors].iloc[test,:].astype(float))[:,1]
full_test_predictions.append(test_predictions)
test_predictions=(full_test_predictions[0]+full_test_predictions[1])/2 # The results of the two algorithms are averaged
test_predictions[test_predictions>.5] = 1
test_predictions[test_predictions<=.5] = 0
predictions.append(test_predictions)
predictions=np.concatenate(predictions,axis=0)
accuracy=sum(predictions==titanic["Survived"])/len(predictions)
print(accuracy)
0.5409652076318743
The result is only a little better than linear regression alone , Therefore, the combined algorithm can be selected again