1、 Draw a line 【 An example 】
import matplotlib.pyplot as plt
import numpy as np
x_axis_data = [1,2,3,4,5,6,7] #x
y_axis_data = [68,69,79,71,80,70,66] #y
plt.plot(x_axis_data, y_axis_data, 'b*--', alpha=0.5, linewidth=1, label='acc')#'bo-' Indicates a solid blue line , Data point solid origin dimension
## plot The meanings of the parameters in are the horizontal axis values , Vertical axis value , The shape of the line ('s' square ,'o' Solid dots ,'*' Five-pointed star ..., Color , transparency , Line width and label ,
plt.legend() # Show the above label
plt.xlabel('time') #x_label
plt.ylabel('number')#y_label
#plt.ylim(-1,1)# Set only y Axis coordinate range
plt.show()
function , obtain :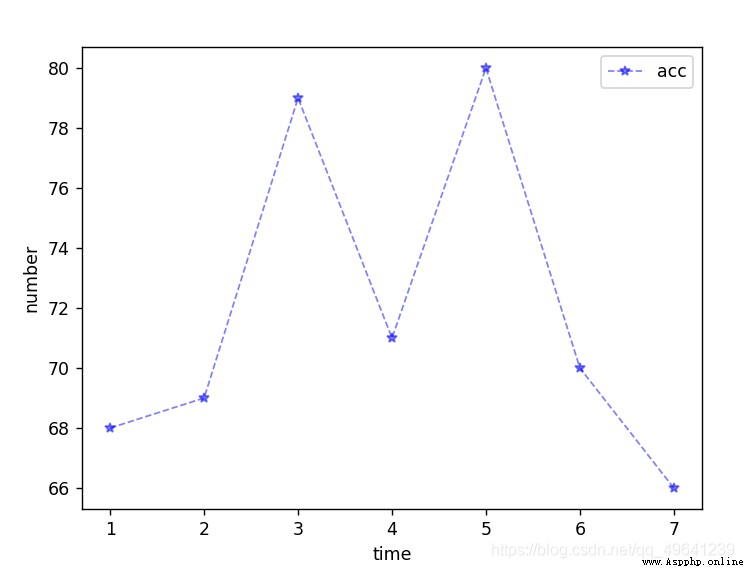
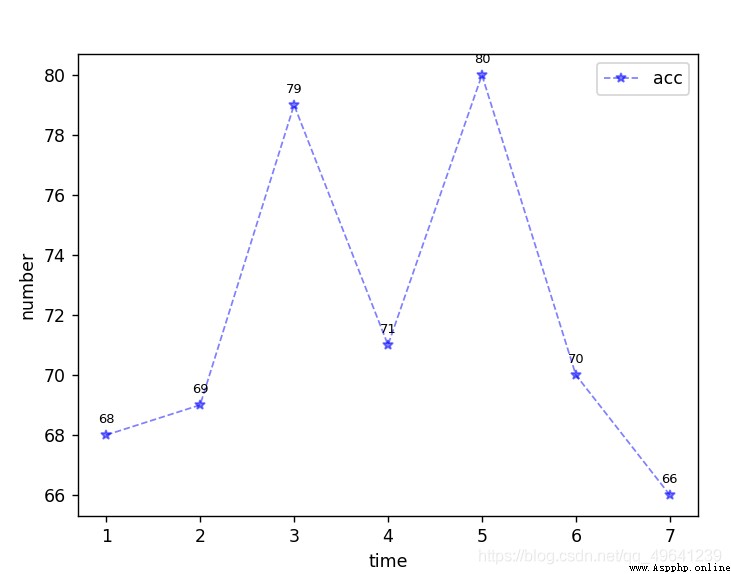
2、 Draw a line chart with data labels
Add this code before the line drawing code :
for x, y in zip(x_axis_data, y_axis_data):
plt.text(x, y+0.3, '%.00f' % y, ha='center', va='bottom', fontsize=7.5)#y_axis_data1 Tagged data
The overall code is as follows :
import matplotlib.pyplot as plt
import numpy as np
x_axis_data = [1,2,3,4,5,6,7] #x
y_axis_data = [68,69,79,71,80,70,66] #y
for x, y in zip(x_axis_data, y_axis_data):
plt.text(x, y+0.3, '%.00f' % y, ha='center', va='bottom', fontsize=7.5)#y_axis_data1 Tagged data
plt.plot(x_axis_data, y_axis_data, 'b*--', alpha=0.5, linewidth=1, label='acc')#'bo-' Indicates a solid blue line , Data point solid origin dimension
## plot The meanings of the parameters in are the horizontal axis values , Vertical axis value , The shape of the line ('s' square ,'o' Solid dots ,'*' Five-pointed star ..., Color , transparency , Line width and label ,
plt.legend() # Show the above label
plt.xlabel('time') #x_label
plt.ylabel('number')#y_label
#plt.ylim(-1,1)# Set only y Axis coordinate range
plt.show()
3、 Draw multiple line charts :
import matplotlib.pyplot as plt
import numpy as np
#epoch,acc,loss,val_acc,val_loss
x_axis_data = [1,2,3,4,5,6,7]
y_axis_data1 = [68.72,69.17,69.26,69.63,69.35,70.3,66.8]
y_axis_data2 = [71,73,52,66,74,82,71]
y_axis_data3 = [82,83,82,76,84,92,81]
# drawing
plt.plot(x_axis_data, y_axis_data1, 'b*--', alpha=0.5, linewidth=1, label='acc')#'
plt.plot(x_axis_data, y_axis_data2, 'rs--', alpha=0.5, linewidth=1, label='acc')
plt.plot(x_axis_data, y_axis_data3, 'go--', alpha=0.5, linewidth=1, label='acc')
plt.legend() # Show the above label
plt.xlabel('time')
plt.ylabel('number')#accuracy
#plt.ylim(-1,1)# Set only y Axis coordinate range
plt.show()
function , obtain :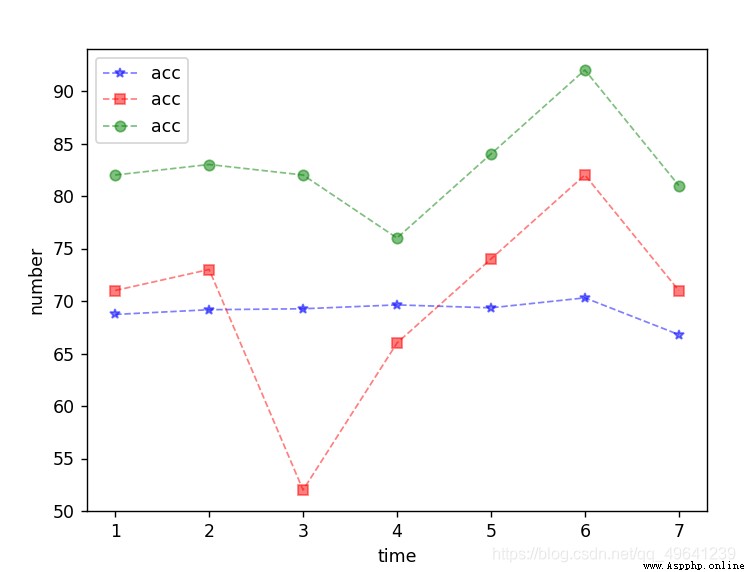
4、 Draw multiple line charts with data labels :
import matplotlib.pyplot as plt
import numpy as np
#epoch,acc,loss,val_acc,val_loss
x_axis_data = [1,2,3,4,5,6,7]
y_axis_data1 = [68.72,69.17,69.26,69.63,69.35,70.3,66.8]
y_axis_data2 = [71,73,52,66,74,82,71]
y_axis_data3 = [82,83,82,76,84,92,81]
# drawing
plt.plot(x_axis_data, y_axis_data1, 'b*--', alpha=0.5, linewidth=1, label='acc')#'
plt.plot(x_axis_data, y_axis_data2, 'rs--', alpha=0.5, linewidth=1, label='acc')
plt.plot(x_axis_data, y_axis_data3, 'go--', alpha=0.5, linewidth=1, label='acc')
## Set the position and size of the data label
for a, b in zip(x_axis_data, y_axis_data1):
plt.text(a, b, str(b), ha='center', va='bottom', fontsize=8) # ha='center', va='top'
for a, b1 in zip(x_axis_data, y_axis_data2):
plt.text(a, b1, str(b1), ha='center', va='bottom', fontsize=8)
for a, b2 in zip(x_axis_data, y_axis_data3):
plt.text(a, b2, str(b2), ha='center', va='bottom', fontsize=8)
plt.legend() # Show the above label
plt.xlabel('time')
plt.ylabel('number')#accuracy
#plt.ylim(-1,1)# Set only y Axis coordinate range
plt.show()
function , obtain :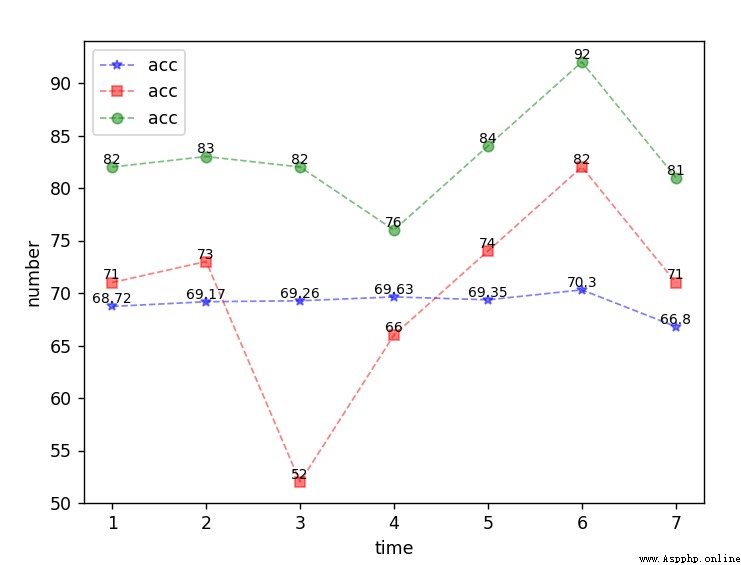
Attach shape , Can match with color :
‘s’ : Square shape
‘o’ : Solid round
‘^’ : Equilateral triangle
‘v’ : An arcuate triangle
‘+’ : Plus
‘*’ : asterisk
‘x’ : x Number
‘p’ : Five-pointed star
‘1’ : Tripod mark
‘2’ : Tripod mark