since 2013 year 6 Baidu month EFE(ExcellentFrontEnd) Developed by the data visualization team ECharts1.0 Publish to GitHub Since the website ,ECharts It has been concerned by the industry authorities and has been widely praised , It has become a mature and popular data visualization chart tool , It has been applied to many data visualization development fields .
Python As the most popular language in the field of data analysis , And joined in ECharts Used rows and columns of , And developed a convenient Python Data visualization tools used by developers , So it was born pyecharts library .
pyecharts It's a response to Python User developed 、 Used to generate ECharts Chart Library , And matplotlib comparison ,pyecharts It has the following advantages :
(1) concise API Make it very convenient for developers to use , And support chain call .
(2) The program is available in the mainstream JupyterNotebook or JupyterLab Run on the tool .
(3) Programs can be easily integrated into Flask、Sanic、Django And other mainstream Web In the frame .
(4) Flexible configuration items can easily match with beautiful charts .
(5) Detailed documentation and examples can help developers get started quickly .
(6)400 Multiple map files 、 Native Baidu maps provide strong support for geographic data visualization .
In the use of pyecharts Before development , Developers need to install... On the local computer first pyecharts.pyecharts Official support v0.5.x and v1 Two versions , The two versions are incompatible . among ,v5.0 Is an earlier version , And maintenance has been stopped ;v1 It's a brand new version of , It supports Python3.6 The above development environment . Up to now ,pyecharts The latest version of is 1.9.1.
Geographic coordinate system maps are suitable for representation and countries , Province , And cities , The distribution of data associated with the position of latitude and longitude .
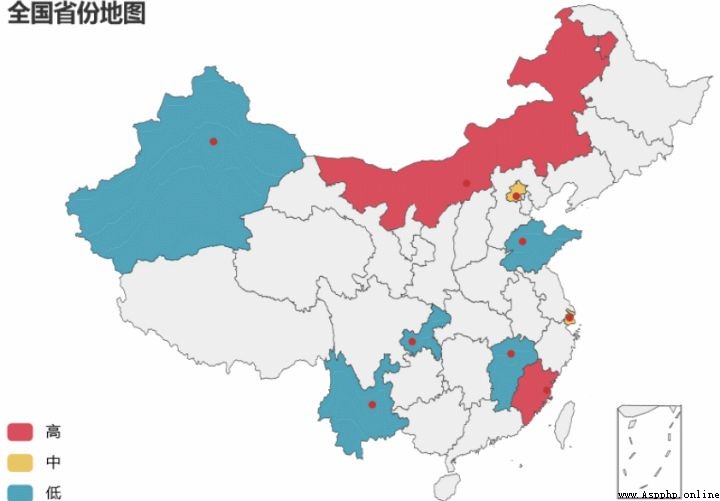
pyecharts in Geo Express data associated with cities ,Map Express data associated with countries and provinces .
# Install the map Accessory Package
!pip install echarts-countries-pypkg
!pip install echarts-china-provinces-pypkg
!pip install echarts-china-cities-pypkg
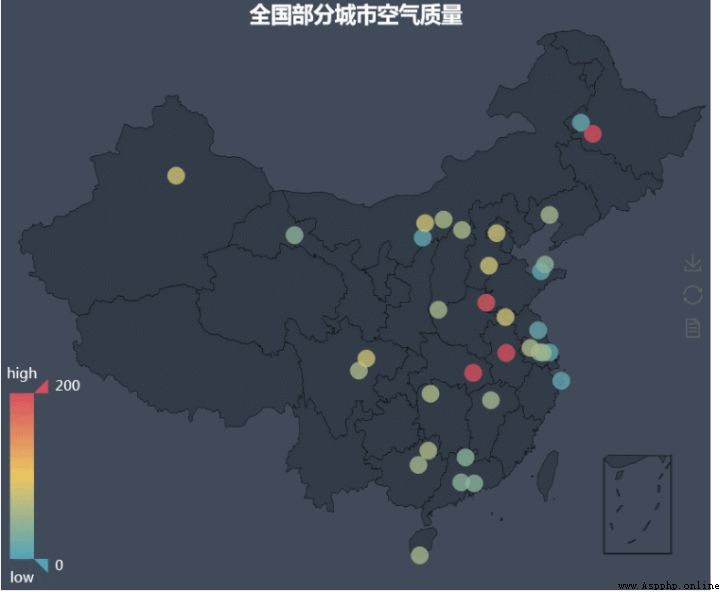
# Example of a national city map
from pyecharts import Geo
data = [
(" Haimen ", 9),(" ordos ", 12),(" Zhaoyuan ", 12),(" zhoushan ", 12),(" Qiqihar ", 14),(" yancheng ", 15),
(" huizhou ", 37),(" Jiangyin ", 37),(" Penglai ", 37),(" Shaoguan ", 38),(" Jiayuguan ", 38),(" Guangzhou ", 38),
(" Zhangjiagang ", 52),(" Sanmenxia ", 53),(" Jinzhou ", 54),(" nanchang ", 54),(" Liuzhou ", 54),(" sanya ", 54),
(" Hohhot, ", 58),(" Chengdu ", 58),(" datong ", 58),(" zhenjiang ", 59),(" guilin ", 59),(" zhangjiajie ", 59),
(" Beijing ", 79),(" xuzhou ", 79),(" hengshui ", 80),(" baotou ", 80),(" mianyang ", 80),(" urumqi ", 84),
(" Heze ", 194),(" Hefei ", 229),(" wuhan ", 273),(" Daqing ", 279)]
geo = Geo(
" Air quality in some cities in China ",
title_color="#fff",
title_pos="center",
width=800,
height=600,
background_color="#404a59",
)
attr, value = geo.cast(data)
geo.add(
"",
attr,
value,
visual_range=[0, 200],
visual_text_color="#fff",
symbol_size=15,
is_visualmap=True,
)
geo
# A map of provinces across the country
from pyecharts import Map
value = [155, 10, 66, 78, 44, 38, 88, 50, 20]
attr = [" fujian "," Shandong "," Beijing "," Shanghai "," jiangxi "," xinjiang "," Inner Mongolia "," yunnan "," Chongqing "]
m = Map(" A map of provinces across the country ", width=600, height=400)
m.add("", attr, value, maptype='china',
is_visualmap=True,
is_piecewise=True,
visual_text_color="#000",
visual_range_text=["", ""],
pieces=[
{"max": 160, "min": 81, "label": " high "},
{"max": 80, "min": 51, "label": " in "},
{"max": 50, "min": 0, "label": " low "},
])
m
# Examples of world maps
from pyecharts import Map
countries= ["China", "Canada", "India", "Russia", "United States","Japan"]
capita_gdp = [13334, 43294, 5903, 23038, 53354,36162]
population = [1376048943, 35939927, 1311050527, 143456918, 321773631,126573481]
life_expectancy = [76.9,81.7,66.8,73.13,79.1,73.13]
m = Map(" The level of world economic development ", width=800, height=500)
m.add(
" Per capita GDP",
attr = countries,
value = capita_gdp,
maptype="world",
is_visualmap=True,
visual_range = [5000,60000],
visual_text_color="#000",
is_map_symbol_show=False,
visual_orient="horizontal"
)
m

 https://blog.csdn.net/itcast_cn/article/details/1223065522022 Artificial intelligence learning roadmap , Clear and definite _ Dark horse programmer's official blog -CSDN Blog _ AI learning route as everyone knows , The era of artificial intelligence has been integrated into our life , Whether image recognition or speech recognition related products have begun to land , Even countries have set artificial intelligence as a national strategic development plan , The development of artificial intelligence will be the frontier of future technology research . Here is a special learning route of artificial intelligence , I hope everyone can have a clear learning direction . The first stage of the article catalogue Introduction to artificial intelligence development 1. Artificial intelligence is python Introduction to programming zero foundation 2、4 Get started Python The second stage of data mining The third stage of machine learning core technology NLP The fourth stage of natural language processing technology CV Computer vision technology 1.AI-OpenCV The image processing 10 Introduction to zero hour Foundation 2https://blog.csdn.net/itcast_cn/article/details/122882407