Mainly to record pandas Study , I want to make a Statistics recently , I look back to the past stata There is a very useful function , Namely tabstat, Statistics can be grouped , And output many indicators .
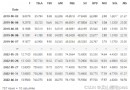
Recently, my data is like this .
I want to follow valid_num grouping , Statistics avg_stand The average of , Standard deviation , Maximum , Minimum . The first thought is stata Of tabstat, It used to be very comfortable . Now change python 了 . It feels like it can be used groupby, But I don't know how to use . Baidu once .
group1 = df_avg.groupby('valid_num')
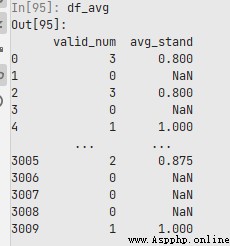
group1['avg_stand'].agg(['mean', 'std', 'count'])It can be used in this way , Output some , Basically what you want .
You can get this result .
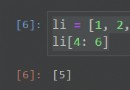
in addition , I need to put valid_num In a group , Like sharing ,
valid_grp = pd.cut(valid_num, [0, 1, 2, 3, 4, 5, 10, 50, 100, 200])After grouping , In Statistics , It's OK, too .
df_avg['vld_grp'] = valid_grp
group2 = df_avg.groupby('vld_grp')
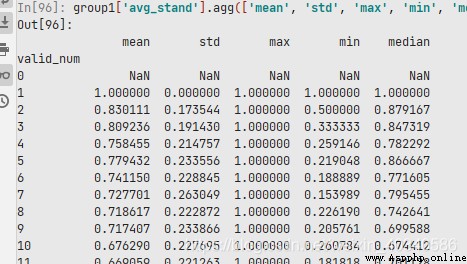
group2['avg_stand'].agg(['mean', 'std', 'max', 'min', 'median']).to_clipboard()The result is :