Preface
1. Loading pictures
2. Grayscale the picture
3. Binarize the image
3.1. Custom threshold
4. Extract outline
5. Draw a rectangle for the outline
6. Split the picture and save
7. View split picture
8. Complete code
PrefaceThe libraries to be installed are :
pip install opencv-python
pip install matplotlib
Python Interface help documentation website :https://docs.opencv.org/4.5.2/d6/d00/tutorial_py_root.html
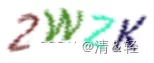
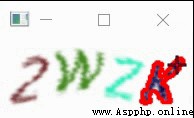
The picture material used in this article :
First , Import the library used :
import cv2import os,shutilfrom matplotlib import pyplot as plt1. Loading pictures Be careful : Here, when the image path is passed in , The path cannot contain Chinese names , Otherwise, an error will be reported !!!
###1, Loading pictures filepath = './testImage.png' ### Image path , Be careful : The path here cannot contain Chinese names img = cv2.imread(filepath)cv2.imshow('Orignal img', img) ### display picture cv2.waitKey(0) ### Prevent a flash , It's a keyboard binding function (0 Means to press any key to terminate )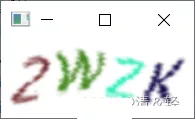
###2, Change the color picture to gray ( Gray processing )img_gray = cv2.cvtColor(img, cv2.COLOR_BGR2GRAY)cv2.imshow('img_gray', img_gray)cv2.waitKey(0)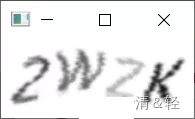
thresh=220 Is a custom set threshold ( Through analysis print(img_gray) Of the image data ), The pixel value is greater than 220 Set to 0, Less than 220 Is set to 255.
maxval= And THRESH_BINARY and THRESH_BINARY_INV The maximum value used with the threshold , Can be understood as fill color , The scope is (0~255).
type: Parameter type threshold type ( cv2.THRESH_BINARY Parts greater than the threshold are set to 255, The less than part is set to 0( Black and white binary ) cv2.THRESH_BINARY_INV The part greater than the threshold is set to 0, The less than part is set to 255( Black and white binary inversion —— White and black ) And other types ...... )
###3, Binarize the picture ''' thresh=220 Is a custom set threshold ( Through analysis print(img_gray) Of the image data ), The pixel value is greater than 220 Set to 0, Less than 220 Is set to 255 maxval= And THRESH_BINARY and THRESH_BINARY_INV The maximum value used with the threshold , Can be understood as fill color , The scope is (0~255). type: Parameter type threshold type ( cv2.THRESH_BINARY Parts greater than the threshold are set to 255, The less than part is set to 0( Black and white binary ) cv2.THRESH_BINARY_INV The part greater than the threshold is set to 0, The less than part is set to 255( Black and white binary inversion —— White and black ) And other types ...... ) '''ret, img_inv = cv2.threshold(src=img_gray, thresh=220, maxval=255, type=cv2.THRESH_BINARY_INV)cv2.imshow('img_inv', img_inv)cv2.waitKey(0)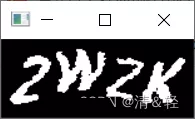
### Threshold comparison ( Global threshold (v = 127), Adaptive average threshold , Adaptive Gaussian threshold )def threshContrast(): filepath = './testImage.png' img = cv2.imread(filepath) img_gray = cv2.cvtColor(img, cv2.COLOR_BGR2GRAY) img_gray = cv2.medianBlur(img_gray, 5) ret1, th1 = cv2.threshold(img_gray, 127, 255, cv2.THRESH_BINARY) th2 = cv2.adaptiveThreshold(img_gray, 255, cv2.ADAPTIVE_THRESH_MEAN_C, cv2.THRESH_BINARY, 11, 2) th3 = cv2.adaptiveThreshold(img_gray, 255, cv2.ADAPTIVE_THRESH_GAUSSIAN_C, cv2.THRESH_BINARY, 11, 2) title = [' original image ( Grayscale )',' Global threshold (v = 127)',' Adaptive average threshold ',' Adaptive Gaussian threshold '] images = [img_gray, th1, th2, th3] for i in range(4): plt.subplot(2, 2, i + 1), plt.imshow(images[i], 'gray') # plt.title(title[i]) ###plt Cannot use Chinese when drawing plt.xticks([]), plt.yticks([]) plt.show()4. Extract outline img_inv It's an image that looks for contours ;
cv2.RETR_EXTERNAL: Indicates that only extreme external contours are retrieved ;
cv2.CHAIN_APPROX_SIMPLE: Compression level , Vertical and diagonal elements , Keep only their endpoint coordinates , for example , The outline of a vertical rectangle is 4 Encode points .
###4, Extract outline ''' https://docs.opencv.org/4.5.2/d4/d73/tutorial_py_contours_begin.html img_inv It's an image that looks for contours ; cv2.RETR_EXTERNAL: Indicates that only extreme external contours are retrieved ; cv2.CHAIN_APPROX_SIMPLE: Compression level , Vertical and diagonal elements , Keep only their endpoint coordinates , for example , The outline of a vertical rectangle is 4 Encode points . ''' contours,hierarchy = cv2.findContours(img_inv, cv2.RETR_EXTERNAL, cv2.CHAIN_APPROX_SIMPLE) print(f' The number of detected contours is :{len(contours)} individual ') print(' The return value is the index of each layer contour :\n', hierarchy)5. Draw a rectangle for the outline ###5, Find out the position of the rectangle drawn by each outline br = []cntid = 0for cnt in contours: '''cnt Indicates the entered contour value ,x,y, w, h Respectively representing circumscribed rectangles x Axis and y Axis coordinates , And rectangular w generous and easygoing h high ,''' x, y, w, h = cv2.boundingRect(cnt) cntid += 1 print(f' Detected No {cntid} The position of the rectangle drawn by the outline is :x={x},y={y},w={w},h={h}') br.append(cv2.boundingRect(cnt)) '''img Represents the input picture to be drawn ( Here is the outline drawn on the original drawing ),cnt Indicates the entered contour value ,-1 Express contours Index of the outline in ( Draw all the outlines here ),(0, 0, 255) Express rgb Color —— Red ,2 Indicates the thickness of the line ''' cv2.drawContours(img, [cnt], -1, (0, 0, 255), 2) cv2.imshow('cnt', img) cv2.waitKey(0)br.sort() ### Sort the tuples in the list in ascending order ( What I want here is to follow the corresponding x The axis coordinates are in ascending order )The process of outlining each character ( Draw from right to left , It may also be intermittent , Here's the picture ).
###6, Split the picture and save ( Here, the binary image data processed previously (img_inv) Segmentation )if not os.path.exists('./imageSplit'): os.mkdir('./imageSplit')else: shutil.rmtree('./imageSplit') os.mkdir('./imageSplit')for x,y,w,h in br: # print(x,y,w,h) # split_image = img_inv[y:y + h, x:x + w] split_image = img_inv[y - 2:y + h + 2, x - 2:x + w + 2] ### This split feels better cv2.imshow('split_image', split_image) cv2.waitKey(0) save_filepath = './imageSplit/' filename = f'{x}.jpg' ### Here, each picture corresponds to x Axis coordinate naming cv2.imwrite(save_filepath + filename, split_image) print(f'\033[31m{filename} The picture is split !\033[0m')Here is the binary image data processed before (img_inv) A character segmentation display process .

Here is what this line of code means , The following figure is drawn manually , Too ugly  , Ha ha ha !!!
# split_image = img_inv[y:y + h, x:x + w]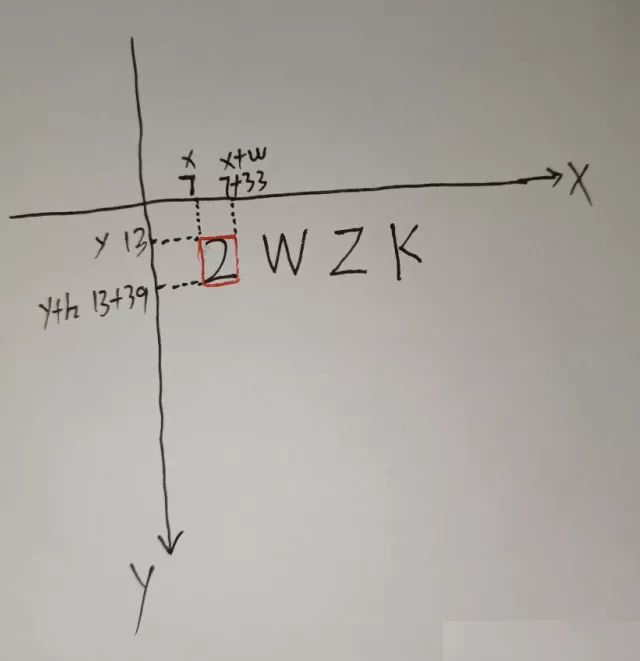
Last , We are pyplot Come up to see the effect of our split image , It is finally finished .
###7, use pyplot Let's see the image after our segmentation imagefile_list = os.listdir('./imageSplit')imagefile_list.sort(key=lambda x: int(x[:-4]))for i in range(len(imagefile_list)): img = cv2.imread(f'./imageSplit/{imagefile_list[i]}') plt.subplot(1, len(imagefile_list), i + 1), plt.imshow(img, 'gray') plt.title(imagefile_list[i]) plt.xticks([]), plt.yticks([])plt.show()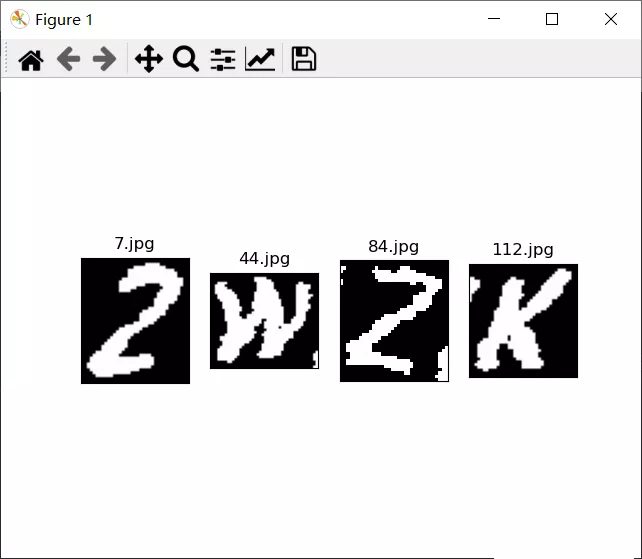
import cv2import os,shutilfrom matplotlib import pyplot as plt''' This is using the document URL :https://docs.opencv.org/4.5.2/index.html This is provided Python Interface tutorial website :https://docs.opencv.org/4.5.2/d6/d00/tutorial_py_root.html'''def imageSplit(): ###1, Loading pictures filepath = './testImage.png' ### Image path , Be careful : The path here cannot contain Chinese names img = cv2.imread(filepath) cv2.imshow('Orignal img', img) ### display picture cv2.waitKey(0) ### Prevent a flash , It's a keyboard binding function (0 Means to press any key to terminate ) ###2, Change the color picture to gray ( Gray processing ) img_gray = cv2.cvtColor(img, cv2.COLOR_BGR2GRAY) cv2.imshow('img_gray', img_gray) cv2.waitKey(0) ###3, Binarize the picture ''' thresh=220 Is a custom set threshold ( Through analysis print(img_gray) Of the image data ), The pixel value is greater than 220 Set to 0, Less than 220 Is set to 255 maxval= And THRESH_BINARY and THRESH_BINARY_INV The maximum value used with the threshold , Can be understood as fill color , The scope is (0~255). type: Parameter type threshold type ( cv2.THRESH_BINARY Parts greater than the threshold are set to 255, The less than part is set to 0( Black and white binary ) cv2.THRESH_BINARY_INV The part greater than the threshold is set to 0, The less than part is set to 255( Black and white binary inversion —— White and black ) And other types ...... ) ''' ret, img_inv = cv2.threshold(src=img_gray, thresh=220, maxval=255, type=cv2.THRESH_BINARY_INV) cv2.imshow('img_inv', img_inv) cv2.waitKey(0) ###4, Extract outline ''' https://docs.opencv.org/4.5.2/d4/d73/tutorial_py_contours_begin.html img_inv It's an image that looks for contours ; cv2.RETR_EXTERNAL: Indicates that only extreme external contours are retrieved ; cv2.CHAIN_APPROX_SIMPLE: Compression level , Vertical and diagonal elements , Keep only their endpoint coordinates , for example , The outline of a vertical rectangle is 4 Encode points . ''' contours,hierarchy = cv2.findContours(img_inv, cv2.RETR_EXTERNAL, cv2.CHAIN_APPROX_SIMPLE) print(f' The number of detected contours is :{len(contours)} individual ') print(' The return value is the index of each layer contour :\n', hierarchy) ###5, Find out the position of the rectangle drawn by each outline br = [] cntid = 0 for cnt in contours: '''cnt Indicates the entered contour value ,x,y, w, h Respectively representing circumscribed rectangles x Axis and y Axis coordinates , And rectangular w generous and easygoing h high ,''' x, y, w, h = cv2.boundingRect(cnt) cntid += 1 print(f' Detected No {cntid} The position of the rectangle drawn by the outline is :x={x},y={y},w={w},h={h}') br.append(cv2.boundingRect(cnt)) '''img Represents the input picture to be drawn ( Here is the outline drawn on the original drawing ),cnt Indicates the entered contour value ,-1 Express contours Index of the outline in ( Draw all the outlines here ),(0, 0, 255) Express rgb Color —— Red ,2 Indicates the thickness of the line ''' cv2.drawContours(img, [cnt], -1, (0, 0, 255), 2) cv2.imshow('cnt', img) cv2.waitKey(0) br.sort() ### Sort the tuples in the list in ascending order ( What I want here is to follow the corresponding x The axis coordinates are in ascending order ) ###6, Split the picture and save ( Here, the binary image data processed previously (img_inv) Segmentation ) if not os.path.exists('./imageSplit'): os.mkdir('./imageSplit') else: shutil.rmtree('./imageSplit') os.mkdir('./imageSplit') for x,y,w,h in br: # print(x,y,w,h) # split_image = img_inv[y:y + h, x:x + w] split_image = img_inv[y - 2:y + h + 2, x - 2:x + w + 2] ### This split feels better cv2.imshow('split_image', split_image) cv2.waitKey(0) save_filepath = './imageSplit/' filename = f'{x}.jpg' ### Here, each picture corresponds to x Axis coordinate naming cv2.imwrite(save_filepath + filename, split_image) print(f'\033[31m{filename} The picture is split !\033[0m') cv2.destroyAllWindows() ### Delete all windows ###7, use pyplot Let's see the image after our segmentation imagefile_list = os.listdir('./imageSplit') imagefile_list.sort(key=lambda x: int(x[:-4])) for i in range(len(imagefile_list)): img = cv2.imread(f'./imageSplit/{imagefile_list[i]}') plt.subplot(1, len(imagefile_list), i + 1), plt.imshow(img, 'gray') plt.title(imagefile_list[i]) plt.xticks([]), plt.yticks([]) plt.show() print('\nperfect!!!')### Threshold comparison ( Global threshold (v = 127), Adaptive average threshold , Adaptive Gaussian threshold )def threshContrast(): filepath = './testImage.png' img = cv2.imread(filepath) img_gray = cv2.cvtColor(img, cv2.COLOR_BGR2GRAY) img_gray = cv2.medianBlur(img_gray, 5) ret1, th1 = cv2.threshold(img_gray, 127, 255, cv2.THRESH_BINARY) th2 = cv2.adaptiveThreshold(img_gray, 255, cv2.ADAPTIVE_THRESH_MEAN_C, cv2.THRESH_BINARY, 11, 2) th3 = cv2.adaptiveThreshold(img_gray, 255, cv2.ADAPTIVE_THRESH_GAUSSIAN_C, cv2.THRESH_BINARY, 11, 2) title = [' original image ( Grayscale )',' Global threshold (v = 127)',' Adaptive average threshold ',' Adaptive Gaussian threshold '] images = [img_gray, th1, th2, th3] for i in range(4): plt.subplot(2, 2, i + 1), plt.imshow(images[i], 'gray') # plt.title(title[i]) ###plt Cannot use Chinese when drawing plt.xticks([]), plt.yticks([]) plt.show()if __name__ == '__main__': imageSplit() ### Threshold comparison # threshContrast()This is about Python The third party opencv This is the end of the article on image segmentation based on the library , More about python Please search the previous articles of SDN or continue to browse the related articles below. I hope you can support SDN more in the future !