Recent research Yolov2 At the time of the paper , It is found that the index used by the author in a priori box clustering is not Euclidean distance , It is IOU. After looking for a lot of information , Basically Python There is no user-defined index clustering function , So I plan to make one by myself
Set the training set shape yes [n_sample, n_feature], The basic idea is :
Because the user-defined distance function was intended to be used at the beginning of the design , So derivation is a big problem . The author is not just , Finally decided to resort to PyTorch The natural advantage of automatic derivation
First, the calculation function of Euclidean distance is given
def Eu_dist(data, center):
""" With Euclidean distance Calculate a function for the distance of the clustering criterion
data: Form like [n_sample, n_feature] Of tensor
center: Form like [n_cluster, n_feature] Of tensor"""
data = data.unsqueeze(1)
center = center.unsqueeze(0)
dist = ((data - center) ** 2).sum(dim=2)
return dist
Then there is the code of the cluster : You only need to pay attention to __init__、fit、classify function
import torch
import numpy as np
import matplotlib.pyplot as plt
Adam = torch.optim.Adam
def get_progress(current, target, bar_len=30):
""" current: Current number of completed tasks
target: Total tasks
bar_len: Progress bar length
return: Progress bar string """
assert current <= target
percent = round(current / target * 100, 1)
unit = 100 / bar_len
solid = int(percent / unit)
hollow = bar_len - solid
return "■" * solid + "□" * hollow + f" {current}/{target}({percent}%)"
class Cluster:
""" Clustering machine
n_cluster: Number of cluster centers
dist_fun: Distance calculation function
kwargs:
data: Form like [n_sample, n_feather] Of tensor
center: Form like [n_cluster, n_feature] Of tensor
return: Form like [n_sample, n_cluster] Of tensor
init: Initial cluster center
max_iter: Maximum number of iterations
lr: Center point coordinate learning rate
stop_thresh: Stop training loss Floating threshold
cluster_centers_: Cluster center
labels_: Clustering results """
def __init__(self, n_cluster, dist_fun, init=None, max_iter=300, lr=0.08, stop_thresh=1e-4):
self._n_cluster = n_cluster
self._dist_fun = dist_fun
self._max_iter = max_iter
self._lr = lr
self._stop_thresh = stop_thresh
# Initialize parameters
self.cluster_centers_ = None if init is None else torch.FloatTensor(init)
self.labels_ = None
self._bar_len = 20
def fit(self, data):
""" data: Form like [n_sample, n_feature] Of tensor
return: loss Floating log """
if self.cluster_centers_ is None:
self._init_cluster(data, self._max_iter // 5)
log = self._train(data, self._max_iter, self._lr)
# Start several rounds of training , obtain loss Floating log
return log
def classify(self, data, show=False):
""" data: Form like [n_sample, n_feature] Of tensor
show: Draw classification results
return: Category labels """
dist = self._dist_fun(data, self.cluster_centers_)
self.labels_ = dist.argmin(axis=1)
# Load tags into instance properties
if show:
for idx in range(self._n_cluster):
container = data[self.labels_ == idx]
plt.scatter(container[:, 0], container[:, 1], alpha=0.7)
plt.scatter(self.cluster_centers_[:, 0], self.cluster_centers_[:, 1], c="gold", marker="p", s=50)
plt.show()
return self.labels_
def _init_cluster(self, data, epochs):
self.cluster_centers_ = data.mean(dim=0).reshape(1, -1)
for idx in range(1, self._n_cluster):
dist = np.array(self._dist_fun(data, self.cluster_centers_).min(dim=1)[0])
new_cluster = data[np.random.choice(range(data.shape[0]), p=dist / dist.sum())].reshape(1, -1)
# Take a new center point
self.cluster_centers_ = torch.cat([self.cluster_centers_, new_cluster], dim=0)
progress = get_progress(idx, self._n_cluster, bar_len=self._n_cluster if self._n_cluster <= self._bar_len else self._bar_len)
print(f"\rCluster Init: {progress}", end="")
self._train(data, epochs, self._lr * 2.5, init=True)
# When initializing the cluster center, use a larger lr
def _train(self, data, epochs, lr, init=False):
center = self.cluster_centers_.cuda()
center.requires_grad = True
data = data.cuda()
optimizer = Adam([center], lr=lr)
# Load central data into GPU On
init_patience = int(epochs ** 0.5)
patience = init_patience
update_log = []
min_loss = np.inf
for epoch in range(epochs):
# Classify the samples and update the center point
sample_dist = self._dist_fun(data, center).min(dim=1)
self.labels_ = sample_dist[1]
loss = sum([sample_dist[0][self.labels_ == idx].mean() for idx in range(len(center))])
# loss function : The sum of the minimum distances from all samples to the center point - Minimum spacing between center points
loss.backward()
optimizer.step()
optimizer.zero_grad()
# Back propagation gradient update center point
loss = loss.item()
progress = min_loss - loss
update_log.append(progress)
if progress > 0:
self.cluster_centers_ = center.cpu().detach()
min_loss = loss
# Record the center point after leaving the calculation diagram
if progress < self._stop_thresh:
patience -= 1
# Patience decreases
if patience < 0:
break
# Exit when the patience value returns to zero
else:
patience = init_patience
# Restore patience
progress = get_progress(init_patience - patience, init_patience, bar_len=self._bar_len)
if not init:
print(f"\rCluster: {progress}\titer: {epoch + 1}", end="")
if not init:
print("")
return torch.FloatTensor(update_log)KMeans++ It is a classical clustering algorithm based on Euclidean distance . stay iris On dataset ,KMeans++ Far faster than my cluster . But in my rounds of repeated comparative tests , My clustering accuracy is not bad —— You can see that the clustering results in the figure below are completely consistent
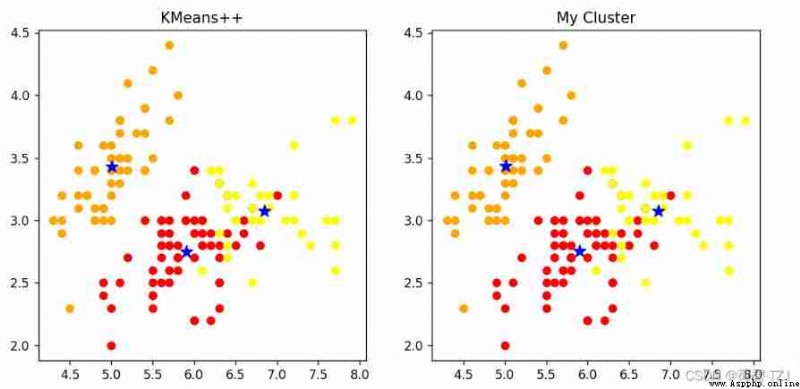
[[5.9016, 2.7484, 4.3935, 1.4339],
[5.0060, 3.4280, 1.4620, 0.2460],
[6.8500, 3.0737, 5.7421, 2.0711]]
[[5.9016, 2.7485, 4.3934, 1.4338],
[5.0063, 3.4284, 1.4617, 0.2463],
[6.8500, 3.0741, 5.7420, 2.0714]]
Although the speed is not good compared with the old algorithm , But the biggest highlight of my cluster is Custom distance function
Originally wanted to use Yolov4 Detection frame clustering is introduced CIoU Do clustering , But there is no way to solve the problem of gradient dispersion , So it's second best DIoU
def DIoU_dist(boxes, anchor):
""" With DIoU Calculate a function for the distance of the clustering criterion
boxes: Form like [n_sample, 2] Of tensor
anchor: Form like [n_cluster, 2] Of tensor"""
n_sample = boxes.shape[0]
n_cluster = anchor.shape[0]
dist = Eu_dist(boxes, anchor)
# Calculate the Euclidean distance
union_inter = torch.prod(boxes, dim=1).reshape(-1, 1) + torch.prod(anchor, dim=1).reshape(1, -1)
boxes = boxes.unsqueeze(1).repeat(1, n_cluster, 1)
anchor = anchor.unsqueeze(0).repeat(n_sample, 1, 1)
compare = torch.stack([boxes, anchor], dim=2)
# Combined detection box and anchor Information about
diag = torch.sum(compare.max(dim=2)[0] ** 2, dim=2)
dist /= diag
# Calculate the diagonal length of the circumscribed rectangle
inter = torch.prod(compare.min(dim=2)[0], dim=2)
iou = inter / (union_inter - inter)
# Calculation IoU
dist += 1 - iou
return dist
I took it DroneVehicle Data sets 650156 Cluster the sizes of prediction boxes , During this process, it is found that there are too many prediction frames with small size , Cause the cluster center to gather near the origin . So for loss Function has been improved : First classification , Then calculate the sum of the maximum distances under each category
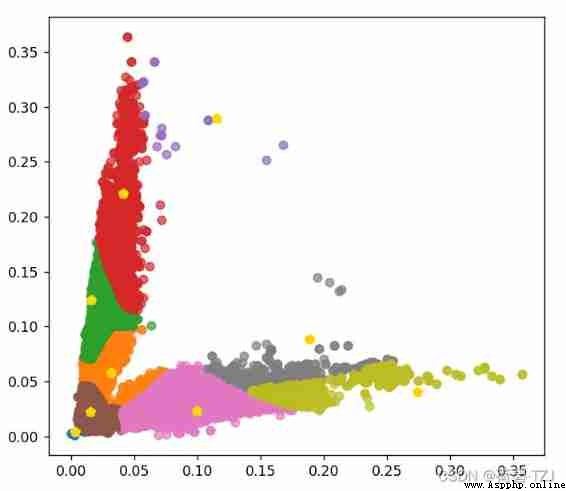
The horizontal axis indicates the width of the detection box , The vertical axis indicates the height of the detection box , The values are all relative to the size of the original drawing . If the size of the original drawing is 608 * 608, Obtained 9 A priori box is :
[ 2, 3 ][ 9, 13 ][ 19, 35 ][ 10, 76 ][ 60, 14 ][ 25, 134 ][ 167, 25 ][ 115, 54 ][ 70, 176 ]