dstat It can display very comprehensive monitoring information on one interface , therefore , In system monitoring 、 Especially useful in application scenarios such as benchmarking and troubleshooting . We can use dstat Monitor the use of all system resources , And the monitoring resources can be customized according to different scenarios . for example , Compare network bandwidth and disk throughput at the same time and frequency .dstat The monitoring information will be displayed in the form of a list , And output with different colors , Display monitoring values in readable units . For example, for byte values ,dstat Automatically based on the size of the value , With K、M、G Display by other units , It avoids the confusion and errors caused by too large values when developers use other commands . Besides , Use dstat It is also very convenient to write plug-ins to collect monitoring information that is not collected by default .dstat It is specially designed for people to view monitoring information in real time , therefore , The monitoring result is output to the screen terminal by default . We can also monitor information to csv Format output to file , For subsequent processing .
If the operating system is not installed by default dstat, that , We need to install it manually .
sudo apt-get install dstat
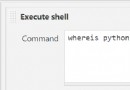
dstat Ordered --version Options , In addition to showing dstat Out of version of , The version of the operating system is also displayed 、Python Language version 、cpu The number of , as well as dstat List of supported plug-ins and other details .
Input directly at the terminal dstat command ,dstat Will run with default parameters . By default dstat Will collect cpu、 disk 、 The Internet 、 Page breaks and system information , And output once a second , Until we press ctrl+c end . If no parameters are added , It is used by default -cdngy Parameter operation .
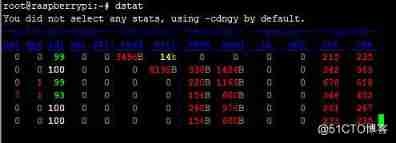
-c: Show cpu Usage situation . These columns show cpu Percentage of time spent on various operations , Includes executing user code (usr)、 Execute system code (sys)、 Free (idl) And wait for IO(wai). If usr The value of is relatively high , Describe the current system cpu Larger load ; If wai At a relatively large value for a long time , Explain the system IO Waiting is more serious ;
-d: Displays the read / write status of the disk , You can use this field to observe the current disk load during performance testing ;
-n: Data sent and received by network devices , This column shows the total number of data sent and received by the network ;
-g: Indicates a page feed activity . Most of the time you want to see in( substitutions ) and out( Swap out ) The value of is 0. If not for 0, The current system memory is insufficient , It will seriously affect the performance of the application ;
-y: System statistics . This one shows the interrupt (int) And context switch (csw).
There are other parameters
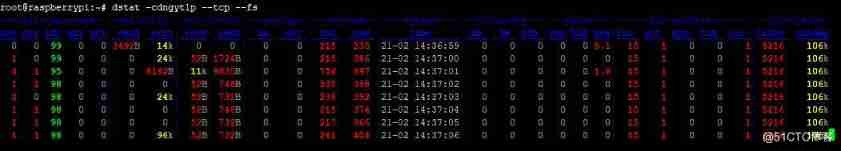
-t: Display the current time of the statistical system ;
-l: Statistics of system load , Include l minute 、5 minute 、15 Minute average ;
-p: Statistics process information , Include runnable,blocked and new The number of processes ;
--tcp: Show commonly used TCP Statistics ;
--fs: Count the number of open files and inodes Count .
In addition to the parameters related to monitoring items described above ,dstat It can be like vmstat and iostat Use parameters to control the time interval of the report , Or specify the time interval and the number of reports at the same time . The following command means to run with the default options dstat, Output a monitoring message every two seconds , And in the output 10 Exit after monitoring information dstat.
$ dstat 2 10
dstat It's not just because it aggregates the monitoring results of multiple tools , And because it can realize some advanced functions through the attached plug-ins , For example, find out the processes and users that occupy the most resources .
If viewing the current occupation I/O、cpu、 The highest process information such as memory can be used --top-mem --top-io --top-cpu Options .
dstat
--top
-mem
--top
-io
--top
-cpu
dstat You can also save monitoring information to csv In file , For subsequent processing . adopt --output Option specifies the file to monitor data output .
dstat
--output out.csv
glances It's a utility model Python Language development 、 be based on psutil Cross platform system monitoring tool based on . Of all the Linux In command line tools , It is associated with top Commands are most similar , Command line interactive monitoring tools . however glances Achieved top Command more complete monitoring , More functions are provided .
glances It can display important system information on the user terminal in real time , And refresh the content dynamically .glances every other 3 Seconds to refresh , We can also use command line parameters to change the refresh frequency . And dstat The same thing ,glances You can save the captured data to a file ; The difference is glances Provides API Interface so that the application can glances Get data in .
stay Linux In the system , have access to apt-get Order or pip Command to install glances
sudo apt-get install glances
glances Is very simple to use , Direct input glances The command goes into a similar top Interactive interface of commands .
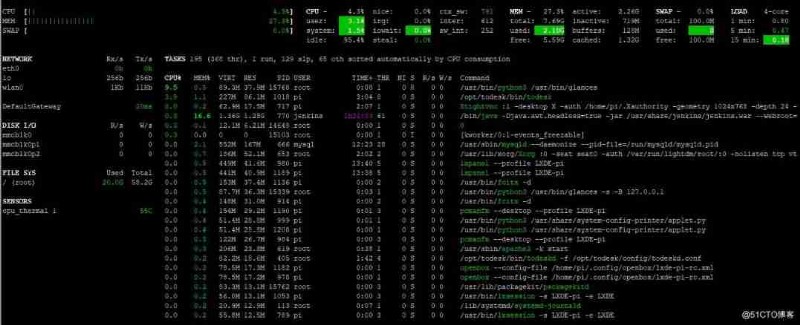
To increase readability ,glances Will show different states in different colors . among , Green means good performance , Do any extra work ; Blue indicates that there are some small problems with the system performance , Users should start to focus on system performance ; Purple indicates performance alarm , Measures should be taken ; Red means serious performance problems , Should be dealt with immediately .
glances Is an interactive tool . therefore , We can also enter commands to control glances act .glances Common commands in are :
h: Display help information ;
q: Exit program exit ;
c: according to CPU Real time load sorts system processes ;
m: Sort system processes by memory usage ;
i: according to I/O Usage sorts system processes ;
p: Sort by process name ;
d: Show or hide disk read / write status ;
f: Show or hide file system information ;
1: Show each... Separately CPU Usage situation .