from tqsdk import TqApi, TqAuth, tafunc
api = TqApi(auth=TqAuth("信易賬號", "密碼"))
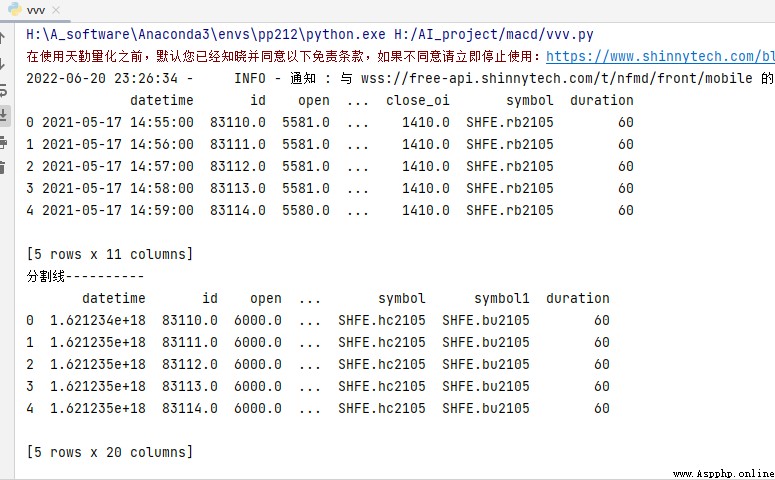
kline = api.get_kline_serial("SHFE.rb2105", 60,data_length=5)
# 用map函數把'datetime'列的每一個時間戳轉換成datetime.datetime 類型
kline.datetime = kline.datetime.map(tafunc.time_to_datetime)
print(kline) #打印轉換時間戳後的K線
print('分割線----------')
print(f'最新K線收盤價:{kline.iloc[-1].close},前一根K線收盤價:{kline.iloc[-2].close}')
api.close()kline.datetime = kline.datetime.map(tafunc.time_to_datetime)
轉換成標准時間
 Python uses redis tutorial to knock the blackboard and draw the key points
WIN7 python Use Redis The goal
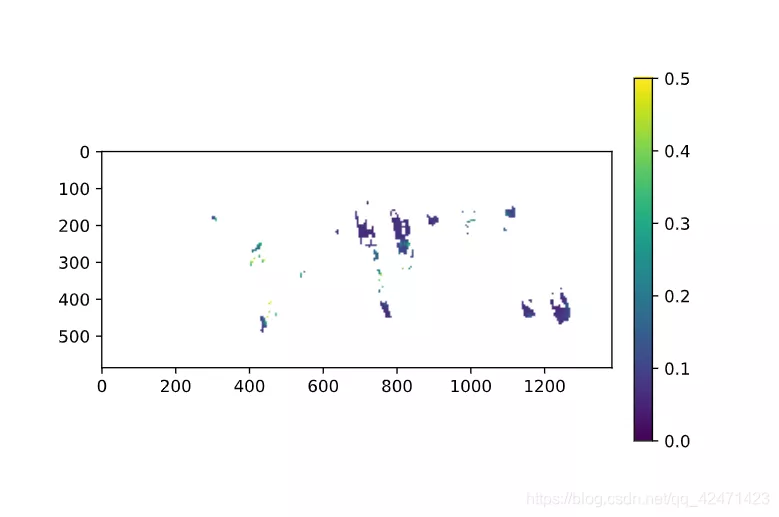 How to use Python to modify matplotlib pyplot. Position of the colorbar to align the main image
Catalog Problem description