Problem description
Method
0. plt.colorbar Parameter Introduction
1. plt.colorbar(im, fraction=0.046, pad=0.04, shrink=1.0)
2. make_axes_locatable
3. make_axes_locatables Upgraded version
4. Hand to colorbar Add one axe
summary
Problem description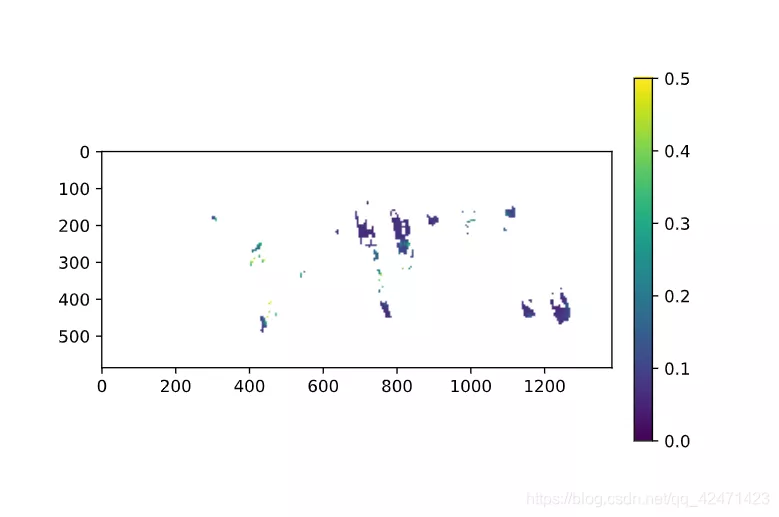
A picture like this , I want to put the one on the right colorbar Set to the same height as the main drawing
Method 0. plt.colorbar Parameter Introductionhttps://matplotlib.org/stable/api/_as_gen/matplotlib.pyplot.colorbar.html?highlight=colorbar#matplotlib.pyplot.colorbar
1. plt.colorbar(im, fraction=0.046, pad=0.04, shrink=1.0)fraction It can be downloaded from 0.035-0.046 Adjust to find the right size
But when the image is long 、 When the high contrast is too large , It may not work
2. make_axes_locatableThis is a matplotlib A function in the package
from mpl_toolkits.axes_grid1 import make_axes_locatableim = plt.imshow(data)divider = make_axes_locatable(plt.gca())cax = divider.append_axes("right", size="5%", pad="3%")plt.colorbar(im, cax=cax)It is not applicable to axe( Will report a mistake ), Such as cartopy Of GeoAxes
3. make_axes_locatables Upgraded versionhttps://stackoverflow.com/questions/18195758/set-matplotlib-colorbar-size-to-match-graph @Matthias
import matplotlib.pyplot as pltfrom mpl_toolkits import axes_grid1def add_colorbar(im, aspect=20, pad_fraction=0.5, **kwargs): """Add a vertical color bar to an image plot.""" divider = axes_grid1.make_axes_locatable(im.axes) width = axes_grid1.axes_size.AxesY(im.axes, aspect=1./aspect) pad = axes_grid1.axes_size.Fraction(pad_fraction, width) current_ax = plt.gca() cax = divider.append_axes("right", size=width, pad=pad) plt.sca(current_ax) return im.axes.figure.colorbar(im, cax=cax, **kwargs)Usage examples
im = plt.imshow(np.arange(200).reshape((20, 10)))add_colorbar(im)4. Hand to colorbar Add one axehttps://stackoverflow.com/questions/18195758/set-matplotlib-colorbar-size-to-match-graph @Fei Yao
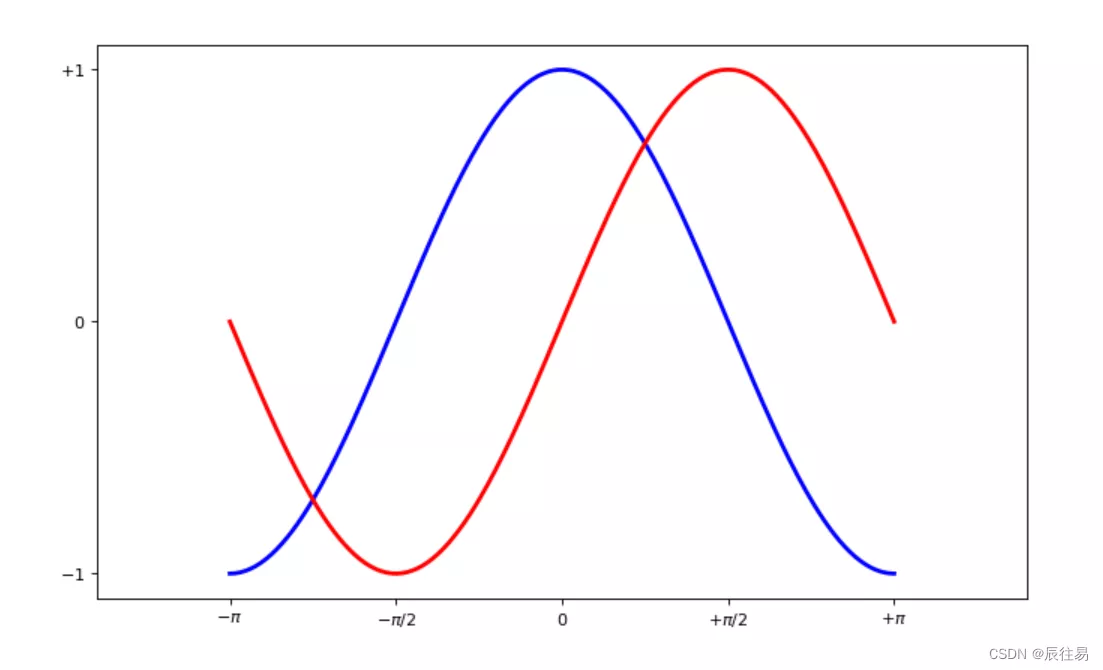
import matplotlib.pyplot as pltimport numpy as npfig=plt.figure()ax = plt.axes()im = ax.imshow(np.arange(100).reshape((10,10)))# Create an axes for colorbar. The position of the axes is calculated based on the position of ax.# You can change 0.01 to adjust the distance between the main image and the colorbar.# You can change 0.02 to adjust the width of the colorbar.# This practice is universal for both subplots and GeoAxes.cax = fig.add_axes([ax.get_position().x1+0.01,ax.get_position().y0,0.02,ax.get_position().height])plt.colorbar(im, cax=cax) # Similar to fig.colorbar(im, cax = cax)Effect display
This is about how to use Python modify matplotlib.pyplot.colorbar This is the end of the article on aligning the position of the main graph , More about Python modify matplotlib.pyplot.colorbar Please search the previous articles of SDN or continue to browse the relevant articles below. I hope you will support SDN more in the future !