Preface
One 、 Simple sine function and cosine function
Two 、 Advanced version sine function and cosine function
1. Change the color and thickness
2. Set picture boundaries
3. Set mark
4. Set the label of the mark
5. Set up X,Y Axis
6. Complete code
3、 ... and 、 Draw a simple line chart
summary
PrefaceMatplotlib May be Python 2D- The most widely used suite in the field of drawing . It makes it easy for users to graph data , And provide a variety of output formats . Here we will explore the use of matplotlib Library to achieve simple graphics rendering .
One 、 Simple sine function and cosine functionIs to get the value of sine function and cosine function :
X It's a numpy Array , Contains from −π To +π Equidistant 256 It's worth .C and S Here are the two 256 The cosine and sine function values corresponding to the values of numpy Array .
X = np.linspace(-np.pi, np.pi, 256,endpoint=True)C,S = np.cos(X), np.sin(X)The complete code is as follows
import numpy as npimport matplotlib.pyplot as pltX = np.linspace(-np.pi, np.pi, 256, endpoint=True)C, S = np.cos(X), np.sin(X)# Draw and display graphics plt.plot(X, C)plt.plot(X, S)plt.show()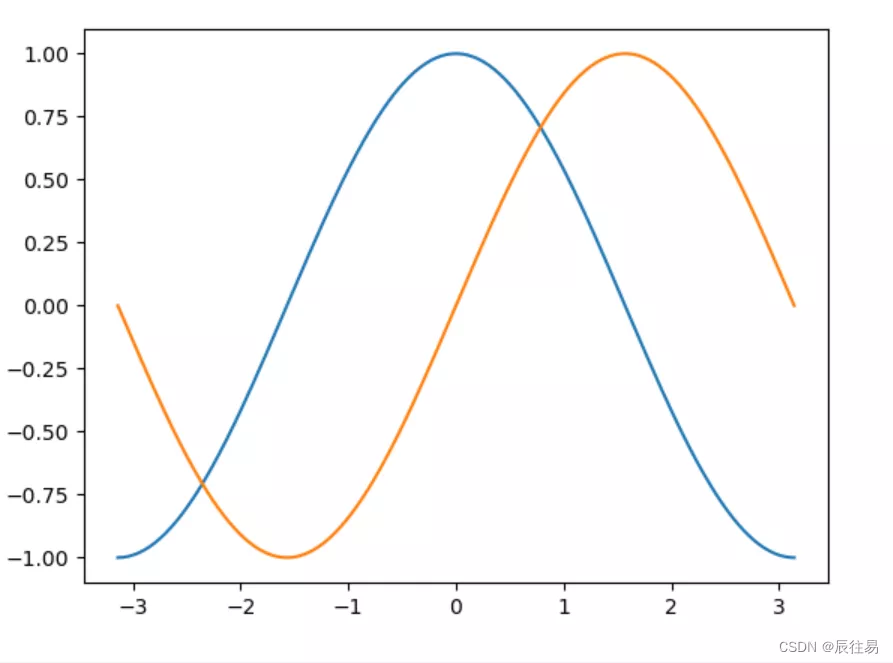
Above we learned the simple sine function and cosine function , Next we will keep improving , Change the color and thickness , Set mark , Adjust borders, etc .
1. Change the color and thicknessWe represent cosine and sine functions in blue and red respectively , Then thicken the lines . Next , Let's stretch the whole picture horizontally .
The code is as follows ( Example ):
figure(figsize=(10, 6), dpi=80)plot(X, C, color="blue", linewidth=2.5, line)plot(X, S, color="red", linewidth=2.5, line)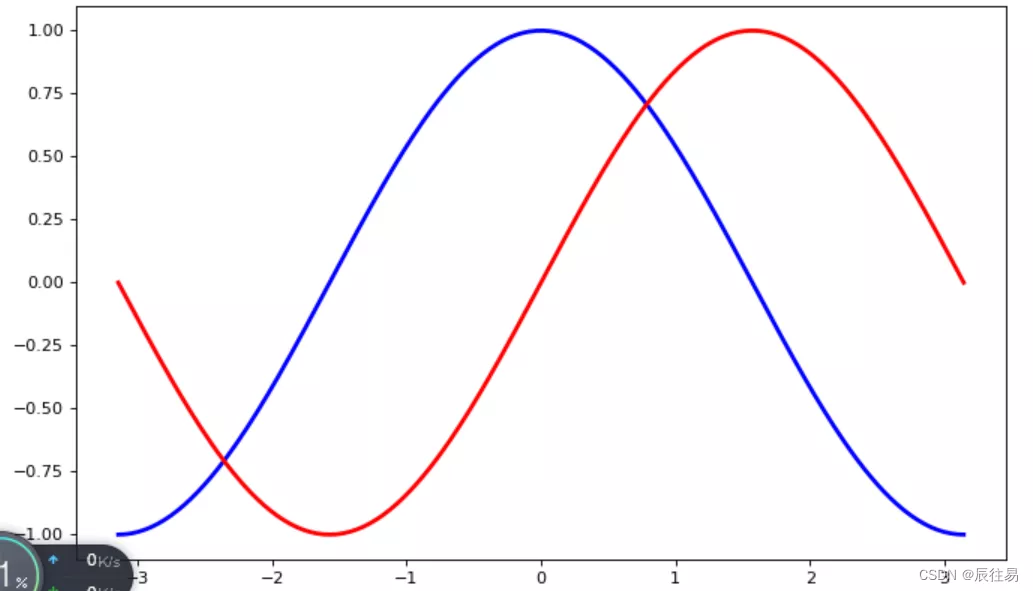
The code is as follows ( Example ):
xmin, xmax = X.min(), X.max()dx = (xmax - xmin) * 0.2xlim(xmin - dx, xmax + dx)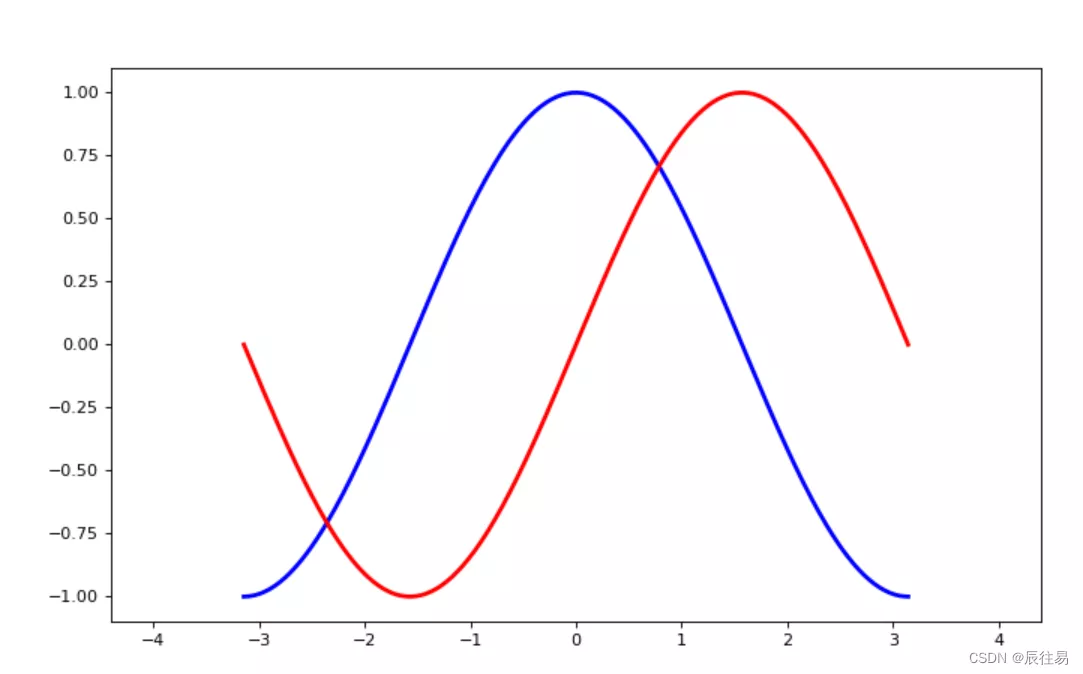
When we talk about sine and cosine functions , Usually I want to know the function in ±π and ±π2 Value .
xticks( [-np.pi, -np.pi/2, 0, np.pi/2, np.pi])yticks([-1, 0, +1])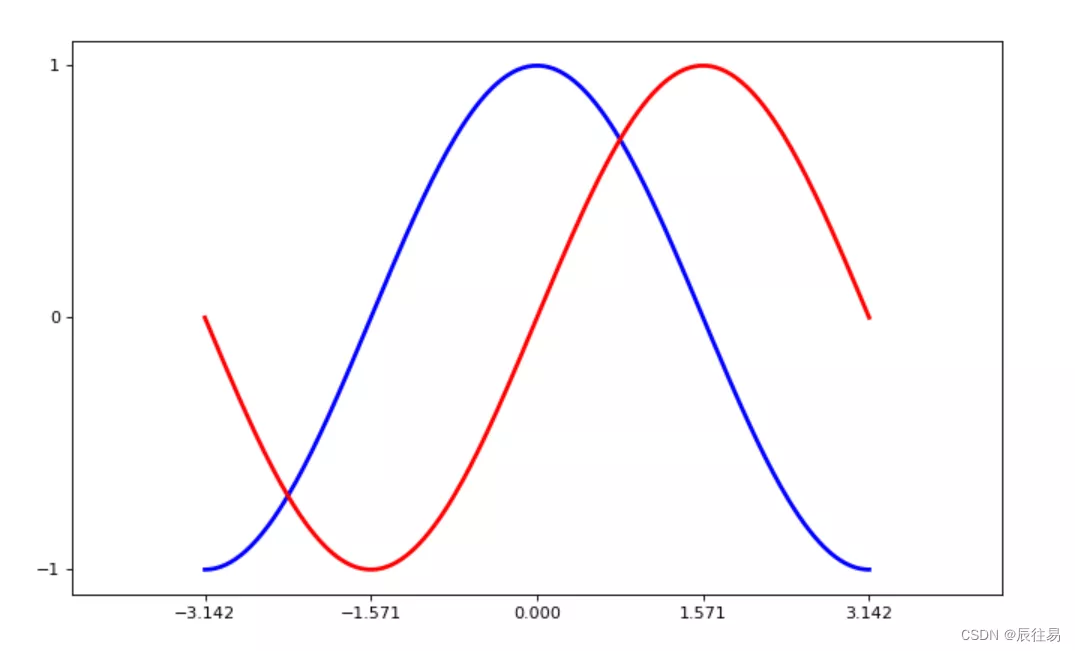
We can 3.142 As if π, But it's not accurate after all . When we set the mark , We can set the label of the mark at the same time . Pay attention to the use of LaTeX.
xticks([-np.pi, -np.pi/2, 0, np.pi/2, np.pi], [r'$-\pi$', r'$-\pi/2$', r'$0$', r'$+\pi/2$', r'$+\pi$'])yticks([-1, 0, +1], [r'$-1$', r'$0$', r'$+1$'])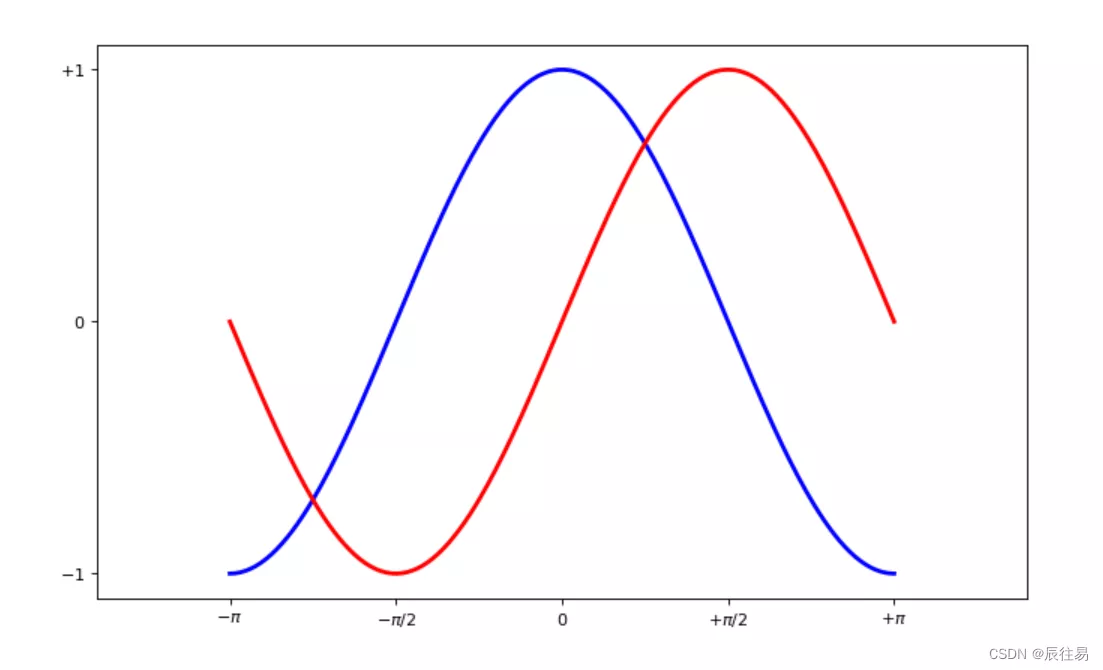
ax = gca()ax.spines['right'].set_color('none')ax.spines['top'].set_color('none')ax.xaxis.set_ticks_position('bottom')ax.spines['bottom'].set_position(('data', 0))ax.yaxis.set_ticks_position('left')ax.spines['left'].set_position(('data', 0))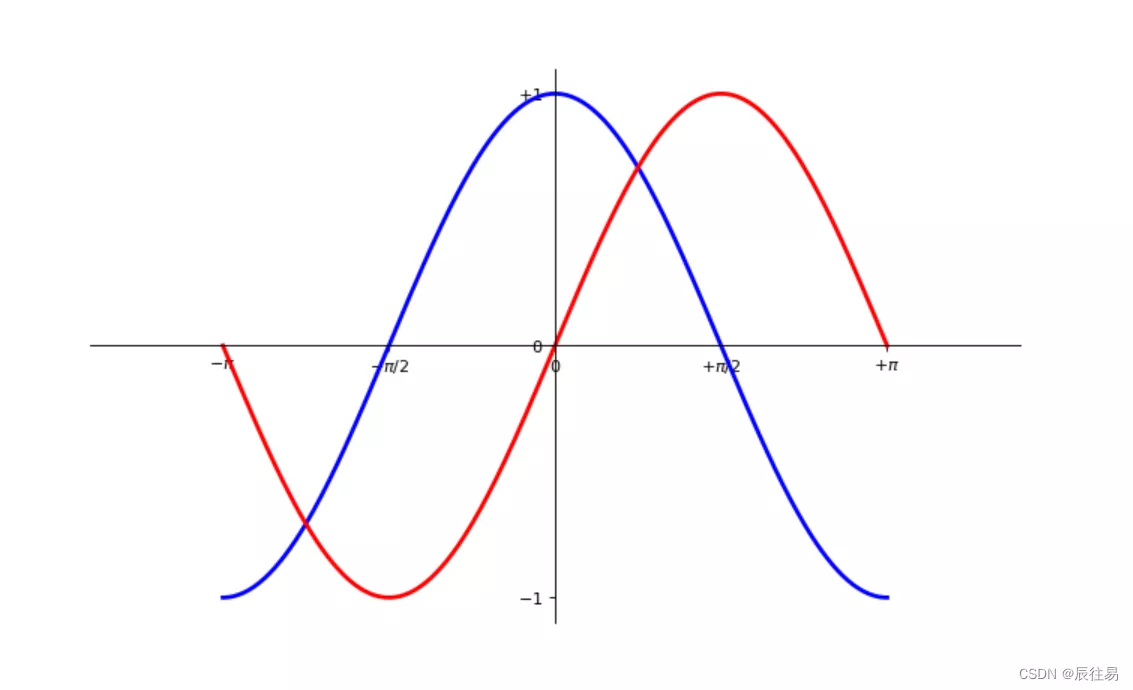
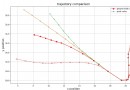
# Import matplotlib All of (nympy It can be used np Use this name )from pylab import *# Create a 8 * 6 spot (point) Graph , And set the resolution to 80figure(figsize=(8, 6), dpi=80)# Create a new 1 * 1 The children of , The next pattern is drawn in the second 1 block ( And the only piece )subplot(1, 1, 1)X = np.linspace(-np.pi, np.pi, 256, endpoint=True)C, S = np.cos(X), np.sin(X)# Drawing cosine curves , Use blue 、 Successive 、 Width is 1 ( Pixels ) Lines of plot(X, C, color="blue", linewidth=1.0, line)# Draw a sine curve , Use green 、 Successive 、 Width is 1 ( Pixels ) Lines of plot(X, S, color="green", linewidth=1.0, line)# Set the upper and lower limits of the horizontal axis xlim(-4.0, 4.0)# Set horizontal axis mark xticks(np.linspace(-4, 4, 9, endpoint=True))# Set the upper and lower limits of the vertical axis ylim(-1.0, 1.0)# Set the vertical axis mark yticks(np.linspace(-1, 1, 5, endpoint=True))# With resolution 72 To save pictures # savefig("exercice_2.png",dpi=72)# Set color and thickness figure(figsize=(10, 6), dpi=80)plot(X, C, color="blue", linewidth=2.5, line)plot(X, S, color="red", linewidth=2.5, line)# Set borders xmin, xmax = X.min(), X.max()dx = (xmax - xmin) * 0.2xlim(xmin - dx, xmax + dx)# Set mark xticks([-np.pi, -np.pi/2, 0, np.pi/2, np.pi])yticks([-1, 0, +1])# Set the label of the mark xticks([-np.pi, -np.pi/2, 0, np.pi/2, np.pi], [r'$-\pi$', r'$-\pi/2$', r'$0$', r'$+\pi/2$', r'$+\pi$'])yticks([-1, 0, +1], [r'$-1$', r'$0$', r'$+1$'])# Set up xy Axis ax = gca()ax.spines['right'].set_color('none')ax.spines['top'].set_color('none')ax.xaxis.set_ticks_position('bottom')ax.spines['bottom'].set_position(('data', 0))ax.yaxis.set_ticks_position('left')ax.spines['left'].set_position(('data', 0))# Show... On the screen show()Final effect
A line chart is a graph that connects data points in order , Can reflect variables y Dependent variable x The change of .Matplotlib Provides plot() Function to draw a line graph , The syntax is as follows :
plt.plot(*args, **kwargs)Common parameters and descriptions are as follows :
x、y: respectively x Axis and y Data corresponding to the axis , Receive list type parameters
color: Represents the color of the polyline
marker: Indicates the type of point on the polyline , Yes “.”、“o”、“v” And so on
linestyle: Indicates the type of polyline , The default is “-”, Said solid line , Set to “--” Indicates a long dashed line , Set to “-.” Said the dotted line , Set to “:” Indicates dotted line
linewidth: Indicates the thickness of the polyline
alpha: Represents the transparency of the point , receive 0~1 Decimal between
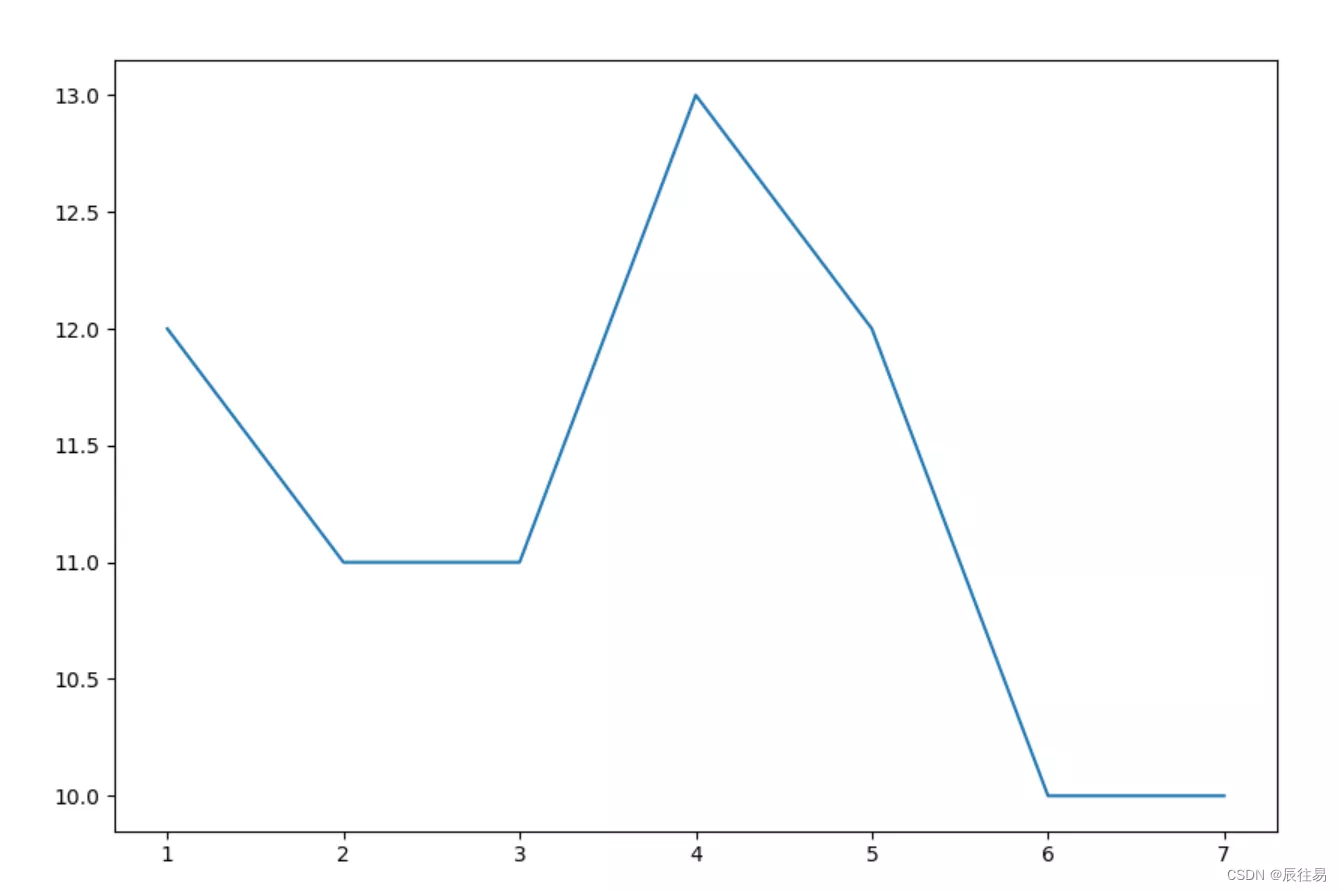
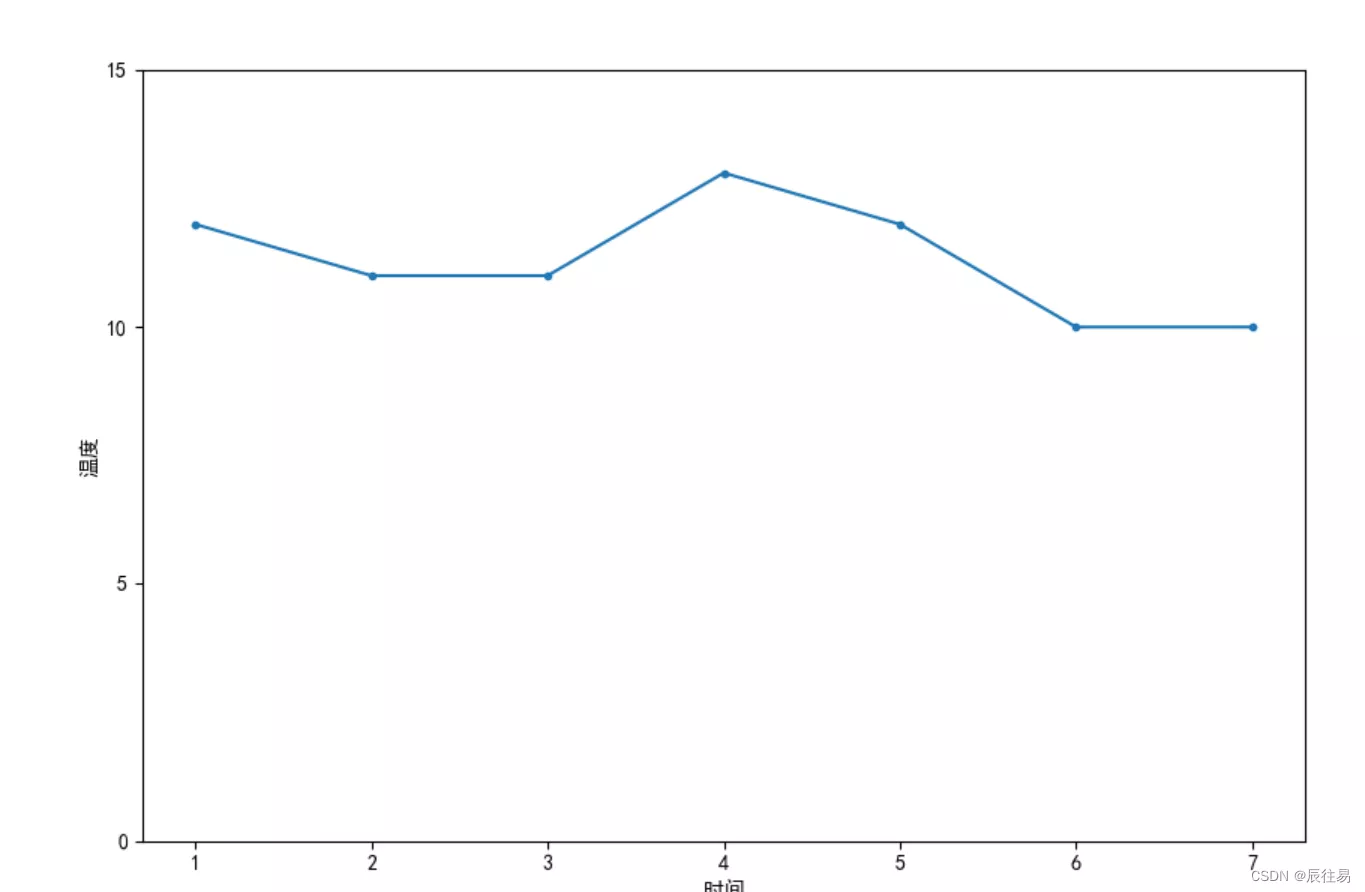
Now we will Take the broken line chart of average temperature change from Monday to Sunday in a certain area as an example , Learn to understand the drawing of line chart .
import matplotlib.pyplot as pltplt.figure(figsize=(10, 8))# Average temperature data from Monday to Sunday plt.plot([1,2,3,4,5,6,7], [12,11,11,13,12,10,10])plt.show()The effect is as follows :
We can add some labels and legends to the chart , Make the chart clearer and better looking , The specific method is as follows :
plt.title(): Specifies the title of the current chart , Include the name 、 Location 、 Color 、 Font size, etc
plt.xlabel(): Specifies the current chart x The name of the shaft 、 Location 、 Color 、 Font size, etc
plt.ylabel(): Specifies the current chart y The name of the shaft 、 Location 、 Color 、 Font size, etc
plt.xlim(): Specifies the current chart x The scope of the shaft
plt.ylim(): Specifies the current chart y The scope of the shaft
plt.xticks(): Specifies the current chart x Axis scale
plt.yticks(): Specifies the current chart y Axis scale
import matplotlib.pyplot as plt# Settings support Chinese plt.rcParams['font.family'] = ['SimHei']plt.figure(figsize=(10, 8))plt.plot([1,2,3,4,5,6,7], [12,11,11,13,12,10,10], line, marker=".")plt.xlabel(" Time ")plt.ylabel(" temperature ")plt.yticks([i for i in range(20)][::5])plt.show()The effect is as follows :
This is about Python How to use Matplotlib This is the end of the article about drawing graphics in Library , More about Python Matplotlib Please search the previous articles of software development network or continue to browse the relevant articles below. I hope you will support software development network more in the future !