This practical project has passed python Crawling for Douban movie Top250 The list , utilize flask The framework and Echarts Chart analysis score 、 Release year and visualize results , And made word cloud , The project has been uploaded to the server , Welcome to criticize and correct .
Project presentation :http://121.36.81.197:5000/
Source code address :https://github.com/lzz110/douban_movies_top250
Learning materials :Python Reptile technology 5 It's a quick success (2020 New collection )
Project technology stack :Flask frame 、Echarts、WordCloud、SQLite
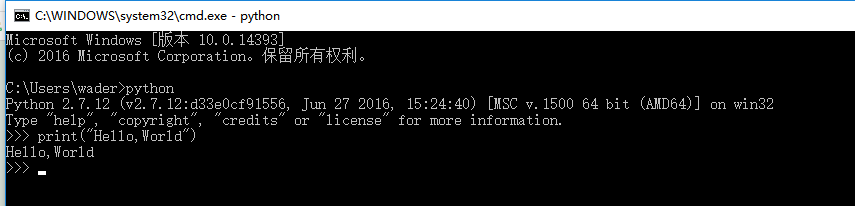
Environmental Science :Python3
Last chapter The data on the website has been crawled and saved to the database , This chapter begins to process the data and visualize it to the page .
Results display : Show the movies in order of rating 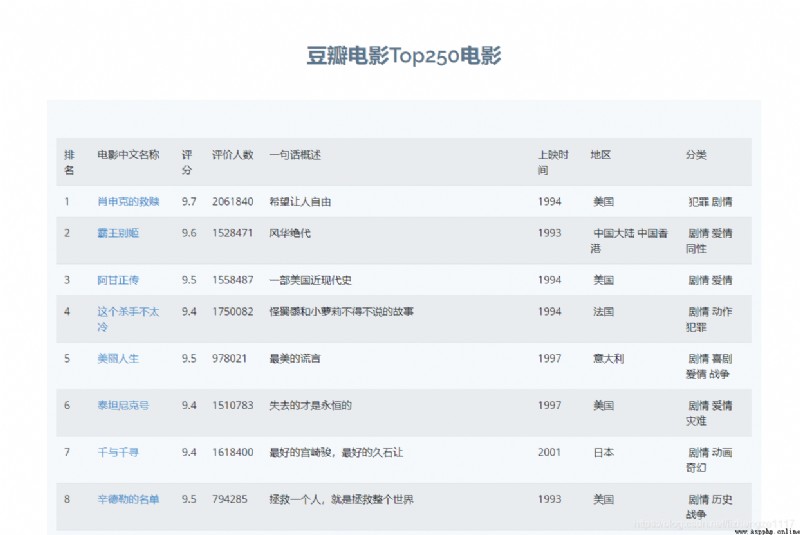
Background core code : Calculate the required data from the database , Return to front end
@app.route('/movie')
def movie():
datalist = []
con = sqlite3.connect("movie.db")
cur = con.cursor()
sql = "select * from movie250"
data = cur.execute(sql)
for item in data:
datalist.append(item)
cur.close()
con.close()
# print(datalist)
return render_template("movie.html",movies = datalist)
Front end core code movie.html:
<section class="counts section-bg">
<div class="container">
<table class="table table-striped">
<tr>
<td> ranking </td>
<td> The Chinese name of the film </td>
<td> score </td>
<td> Number of evaluators </td>
<td> A word summary </td>
<td> Release time </td>
<td> region </td>
<td> classification </td>
</tr>
{% for movie in movies %}
<tr>
<td>{
{movie[0]}}</td>
<td>
<a href="{
{ movie[1] }}" target="_blank">
{
{ movie[3] }}
</a>
</td>
<td>{
{movie[4]}}</td>
<td>{
{movie[5]}}</td>
<td>{
{movie[6]}}</td>
<td>{
{movie[7]}}</td>
<td>{
{movie[8]}}</td>
<td>{
{movie[9]}}</td>
</tr>
{% endfor %}
</table>
</div>
</section><!-- End Counts Section -->
Background core code : Calculate the required data from the database , Return to front end
@app.route('/score')
def score():
score = [] # score
num = [] # The number of films counted by each rating
score2 = [] # score
num2 = [] # The number of films counted by each rating
res={
}
con = sqlite3.connect("movie.db")
cur = con.cursor()
sql = "select score,count(score) from movie250 group by score"
data = cur.execute(sql)
for item in data:
score.append(str(item[0]))
num.append(item[1])
for k, v in zip(score, num):
res.update({
k: v, },)
sql2="select year_release,count(year_release) from movie250 group by year_release"
data2 = cur.execute(sql2)
for item2 in data2:
score2.append(str(item2[0]))
num2.append(item2[1])
#print(num2)
cur.close()
con.close()
return render_template("score.html",score=score,num=num,res=res,num2=num2,score2=score2)
Front end page with Echarts Realization , Please refer to Official website tutorial
Bar chart effect display :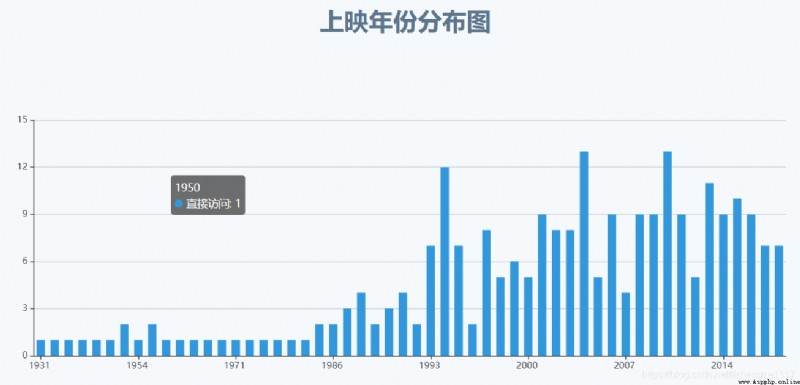
Bar chart core code :
<div class="container">
<div class="section-title">
<h2> Score distribution chart </h2>
</div>
<!-- by ECharts Prepare one with size ( Wide and high ) Of DOM -->
<div id="main" ></div>
<script type="text/javascript"> // Based on the prepared dom, initialization echarts example  var myChart = echarts.init(document.getElementById('main')); var kv = new Array();// Declare a new dictionary  kv = {
{
 res|safe }};// Take out the data transferred in the background , Add... Here safe Filter avoidance warning  var test = new Array();// Declare a new dictionary for storing data  for (var logKey in kv) {
 // Take out the corresponding key value pair and store it in test,logKey Key for the dictionary  test.push({
value: kv[logKey], name: logKey}); } // Specify configuration items and data for the chart  var option = {
 tooltip: {
 trigger: 'item', formatter: '{a} <br/>{b} : {c} ({d}%)' }, legend: {
 orient: 'vertical', left: 'left', data: {
{
 score|tojson }} }, series: [ {
 name: ' source ', type: 'pie', radius: '85%', center: ['50%', '55%'], data: test, emphasis: {
 itemStyle: {
 shadowBlur: 10, shadowOffsetX: 0, shadowColor: 'rgba(0, 0, 0, 0.5)' } } } ] }; // Use the configuration item and data display chart just specified . myChart.setOption(option); </script>
</div>
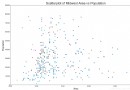
Fan chart effect display :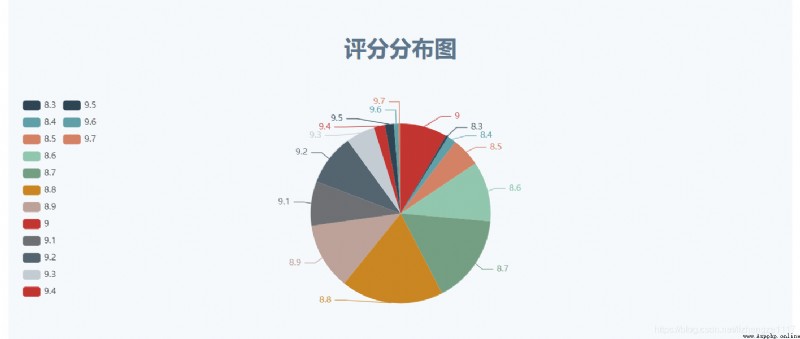
Fan chart core code :
<div class="container">
<div class="section-title">
<h2> Release year distribution map </h2>
</div>
{# <div id="tiaoxing" ></div>#}
<div id="tiaoxing" ></div>
<script type="text/javascript"> // Based on the prepared dom, initialization echarts example  var myChart2 = echarts.init(document.getElementById('tiaoxing')); // Specify configuration items and data for the chart  var option2 = {
 color: ['#3398DB'], tooltip: {
 trigger: 'axis', axisPointer: {
 // Axis indicator , Axis trigger is valid  type: 'shadow' // The default is line , Optional :'line' | 'shadow' } }, grid: {
 left: '3%', right: '4%', bottom: '3%', containLabel: true }, xAxis: [ {
 type: 'category', data: {
{
score2|tojson}}, axisTick: {
 alignWithLabel: true } } ], yAxis: [ {
 type: 'value' } ], series: [ {
 name: ' Direct access ', type: 'bar', barWidth: '60%', data: {
{
 num2 }} } ] }; // Use the configuration item and data display chart just specified . myChart2.setOption(option2); </script>
</div>
The library needed to generate the word cloud :
import jieba # participle
from matplotlib import pyplot as plt # mapping , Data visualization
from wordcloud import WordCloud # The word cloud
from PIL import Image # The image processing
import numpy as np # Matrix operations
import sqlite3 # database
Complete code :
# Prepare the words needed for the word cloud ( word )
con = sqlite3.connect('movie.db')
cur = con.cursor()
sql = 'select category from movie250'
# sql = 'select introduction from movie250'
data = cur.execute(sql)
text = ""
for item in data:
text = text + item[0]
# print(item[0])
# print(text)
cur.close()
con.close()
# participle
cut = jieba.cut(text)
string = ' '.join(cut)
# print(len(string))
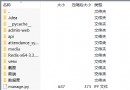
img = Image.open(r'.\static\assets\img\tree.jpg') # Open mask picture
img_array = np.array(img) # Convert the picture to an array
wc = WordCloud(
background_color='white',
mask=img_array,
font_path="msyh.ttc" # Font location :C:\Windows\Fonts
)
wc.generate_from_text(string)
# Drawing pictures
fig = plt.figure(1)
plt.imshow(wc)
plt.axis('off') # Whether the axis is displayed
# plt.show() # Display the generated word cloud image
# Output word cloud image to file
plt.savefig(r'.\static\assets\img\category.jpg',dpi=500)
# plt.savefig(r'.\static\assets\img\test.jpg',dpi=500)
Effect display : Respectively according to the About the movie and The film classification Make word cloud 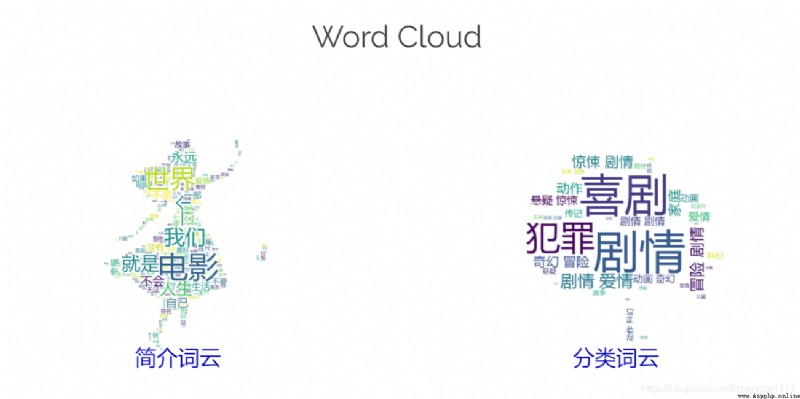
thus The crawler project is done locally , If necessary, it can be uploaded to the ECS , Easy access , Refer to Chapter III for specific steps :flask Upload the project to the server