The theory is introduced
Click here to
A two-dimensional scatter clustering in the code's own example .
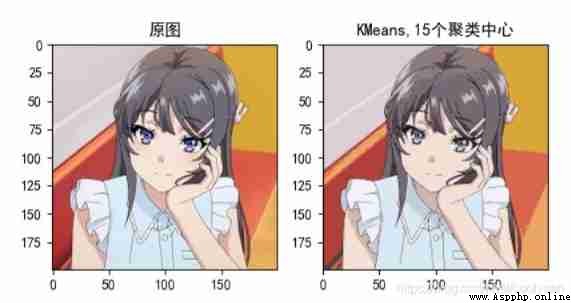
Picture compression :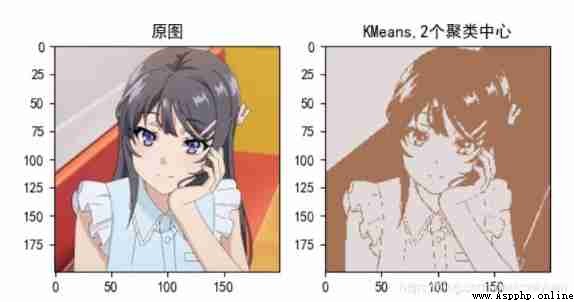
KMeans and KMeans++ Only the steps of initializing the cluster center are different , I have selected both in the code , Just choose what you want to use when calling .
import numpy as np
import matplotlib.pyplot as plt
plt.rcParams['font.sans-serif']=['SimHei']
plt.rcParams['axes.unicode_minus']=False
from sklearn.datasets import load_iris
import random
class K_Means():
def __init__(self,X_data,K):
self.X_data=X_data
self.K=K # Number of cluster centers
self.datanum=X_data.shape[0] # Number of data
print(self.datanum)
self.dim=X_data.shape[-1] # Data dimension
self.AllCenter=[] # Store all cluster centers in the iteration process
self.ALLCluster=[] # Store all clustering results in the iteration process
self.AllJ=[] # Store the iteration process in all error functions
self.oldCenter=np.zeros((self.K, self.dim)) # Store the cluster center of the previous iteration
self.newCenter=self.InitCenter_jia() # Initialize the cluster center , This newCenter Attribute is used to store the cluster center of this iteration
self.AllCenter.append(self.newCenter)
self.iternum=0 # Record the number of iterations
while not (self.oldCenter == self.newCenter).all(): # If the cluster center does not change after two times , End of iteration
if self.iternum > 12: # If the number of iterations is greater than twelve , end
break
print("itter ",self.iternum)
self.distance=self.calculate_distance()
self.oldCenter=self.newCenter
self.newCenter,self.cluster=self.update_Center()
self.J=self.calculate_J()
if (self.oldCenter == self.newCenter).all():
print(" End of the iteration ")
break
self.iternum += 1
self.AllCenter.append(self.newCenter) # Add the cluster center after iteration to the list of storage cluster centers
self.ALLCluster.append(self.cluster)
self.AllJ.append(self.J)
print("newCenter", self.newCenter)
print()
# Initialize cluster center KMeans
def InitCenter(self):
Center = np.zeros((self.K, self.dim))
rand_list= random.sample(list(range(0, self.datanum)), self.K) # Select from all the samples K As the center of the cluster
for i in range(self.K):
print( self.X_data[rand_list[i]])
Center[i] = self.X_data[rand_list[i]]
print(Center[i])
print(Center)
return Center
# Initialize cluster center KMeans++
def InitCenter_jia(self):
Center=np.zeros([self.K,self.dim])
num=0 # Used to record the number of known cluster centers
centerx=self.X_data[random.randint(0,self.datanum-1)] # First initialize a cluster center randomly
Center[num]=centerx
num+=1
while num<self.K:
dis = np.zeros([self.datanum,num])
for i in range(0,self.datanum): # Calculate the distance from all samples to the center of all known clusters
for j in range(0,num):
dis[i][j]=np.linalg.norm(self.X_data[i]-Center[j])
min_dis_For_Data=np.min(dis,axis=1) # Take the distance from each sample to its nearest cluster center
All_dis=np.sum(min_dis_For_Data) # Calculate the total distance
ranDis=All_dis*random.random() # Produce a 0~All_dis Number between
for i in range(0,self.datanum):
ranDis-=min_dis_For_Data[i]
if ranDis<=0:
Center[num]=self.X_data[i]
num+=1
break
return Center
# Matrix of distance from data to cluster center
def calculate_distance(self):
distance=np.zeros([self.datanum, self.K])
for i in range(0,self.datanum):
for k in range(0,self.K):
distance[i, k] = np.linalg.norm(self.X_data[i, :]-self.newCenter[k])
return distance
# Update cluster center
def update_Center(self):
center = np.zeros([self.K,self.dim])
cluster = np.argmin(self.distance, axis=1) # The matrix of the cluster to which the data point belongs
KongCu_List = [] # Store a list of empty cluster sequence numbers
for i in range(0,self.K):
data = self.X_data[cluster==i] # Belong to the first i Data of cluster centers
print(" The first %d Number of cluster points "%i,data.shape[0])
if data.shape[0] != 0: # If it is not an empty cluster
center_i=np.mean(data,axis=0) # Find the center of sample points belonging to the same cluster as the new cluster center
center[i]=center_i
else:
print(" The first %d A cluster is an empty cluster !!!"%i)
KongCu_List.append(i)
# Find the point farthest from the current known cluster center as the empty cluster center
while len(KongCu_List) != 0: # Loop until there are no empty clusters
Centernum = list(range(0,self.K))
NotnullCenter_index =[i for i in Centernum if i not in KongCu_List] # Pick out the index of non empty cluster
NotnullCenter = [] # Store cluster centers of non empty clusters
for i in NotnullCenter_index:
NotnullCenter.append(center[i])
dis = np.zeros([self.datanum,len(NotnullCenter)])
# Calculate the distance from all samples to non empty clusters
for i in range(0, self.datanum):
for k in range(0, len(NotnullCenter)):
dis[i][k] = np.linalg.norm(self.X_data[i]-NotnullCenter[k])
maxdis=np.sum(dis, axis=1) # Sum of distances
maxdisarg=np.argmax(maxdis) # Find the index of the sample with the largest distance
center[KongCu_List.pop()]=self.X_data[maxdisarg] # Take the corresponding sample as the center of the empty cluster
return center, cluster
# Calculation SSE
def calculate_J(self):
J=0
for i in range(0,self.datanum):
J+=np.linalg.norm((self.X_data[i]-self.oldCenter[self.cluster[i]]))**2
return J
def Visual(self):
mark = ['or', 'ob', 'og', 'om', 'oy', 'oc'] # Color and shape of cluster points
center =['Dr', 'Db', 'Dg', 'Dm', 'Dy', 'Dc'] # Cluster center color and shape
figure=plt.figure(figsize=(8,7))
if self.dim == 1: # If the data dimension is 1
ax1 = figure.add_subplot(221)
ax1.scatter([0]*self.datanum,self.X_data.tolist(), s=3)
plt.title(" Scatter before clustering ")
plt.ion()
ax3 = figure.add_subplot(212)
plt.title(" Error function diagram ")
ax2 = figure.add_subplot(222)
x = list(range(self.iternum))
for t in range(0, self.iternum):
ax2.cla()
j = 0
ax3.plot(x[t], self.AllJ[t], "b.") # Print for each iteration SSE
for i in range(0,self.K): # Print cluster center
ax2.plot([0], self.AllCenter[t][i].tolist(), center[i], markersize=5, zorder=2)
if t == self.iternum - 1:
plt.title(" Final clustering result scatter diagram ")
else:
plt.title(" The first %d Clustering results of iterations " % t)
for i in self.ALLCluster[t]:
ax2.plot(self.X_data[j:j + 1, 0].tolist(), mark[i], markersize=3, zorder=1)
j += 1
plt.pause(1.5) # stop 1.5s Print the next iteration result
ax3.plot(self.AllJ, "g-")
plt.ioff()
plt.show()
if self.dim == 2:
ax1 = figure.add_subplot(221)
ax1.scatter(self.X_data[:,0].tolist(), self.X_data[:,1].tolist(),s=3)
plt.title(" Scatter before clustering ")
plt.ion()
ax3 = figure.add_subplot(212)
plt.title(" Error function diagram ")
ax2 = figure.add_subplot(222)
x=list(range(self.iternum))
for t in range(0,self.iternum):
ax2.cla()
j = 0
ax3.plot(x[t], self.AllJ[t],"b.")
for i in range(0,self.K):
ax2.plot(self.AllCenter[t][i,0],self.AllCenter[t][i,1],center[i],markersize=5,zorder=2) # zorder The bigger it is , The more on the upper layer
if t==self.iternum-1:
plt.title(" Final clustering result scatter diagram ")
else:
plt.title(" The first %d Clustering results of iterations " % t)
for i in self.ALLCluster[t]:
ax2.plot(self.X_data[j:j+1,0].tolist(),self.X_data[j:j+1,1].tolist(),mark[i],markersize=3,zorder=1)
j+=1
plt.pause(1.5)
ax3.plot(self.AllJ, "g-")
plt.ioff()
plt.show()
if self.dim==3:
ax1 = figure.add_subplot(221,projection='3d')
ax1.scatter(self.X_data[:, 0].tolist(), self.X_data[:, 1].tolist(),self.X_data[:,2].tolist(),s=3)
plt.title(" Scatter before clustering ")
plt.ion()
ax3 = figure.add_subplot(212)
plt.title(" Error function diagram ")
ax2 = figure.add_subplot(222,projection='3d')
x = list(range(self.iternum))
for t in range(0, self.iternum):
ax2.cla()
j = 0
ax3.plot(x[t], self.AllJ[t], "b.")
ax2.plot(self.AllCenter[t][:, 0].tolist(), self.AllCenter[t][:, 1].tolist(),
self.AllCenter[t][:, 2].tolist(), "k*", label=' Cluster center ', markersize=5, zorder=2)
plt.legend()
if t == self.iternum - 1:
plt.title(" Final clustering result scatter diagram ")
else:
plt.title(" The first %d Clustering results of iterations " % t)
for i in self.ALLCluster[t]:
ax2.plot(self.X_data[j:j + 1, 0].tolist(), self.X_data[j:j + 1, 1].tolist(),self.X_data[j:j + 1, 2].tolist(), mark[i], markersize=3, zorder=1)
j += 1
plt.pause(1.5)
ax3.plot(self.AllJ, "g-")
plt.ioff()
plt.show()
def example0():
N=1000
C=[[N/4,N/2,0,N/2],[N/2,N,0,N/2],[N/4,N/2,N/2,N],[N/2,N,N/2,N]]
data=[]
for i in range(4):
center_datanum=random.randint(20,50)
for j in range(center_datanum):
change=random.randint(20,100)
x=random.randint(C[i][0]+change,C[i][1]-change)
y=random.randint(C[i][2]+change,C[i][3]-change)
data.append([x,y])
data=np.mat(data)
test=K_Means(data,4)
test.Visual()
def example1():
x1 = np.zeros((10, 1))
x2 = np.zeros((10, 1))
for i in range(0, 10):
x1[i] = np.random.rand() * 4
x2[i] = np.random.rand() * 5 + 5
x = np.append(x1, x2, axis=0)
test = K_Means(x, 2)
test.Visual()
def example2():
data=load_iris().data[: , 2:] # take iris The last two columns of the dataset
test=K_Means(data,3)
test.Visual()
def example3():
data=load_iris().data[:,1:] # take iris The last three columns of the dataset
test=K_Means(data,3)
test.Visual()
if __name__ == '__main__':
example0()
example1()
example2()
example3()
2. Image compression code
import matplotlib.pyplot as plt
import cv2
from KMeans_jia import K_Means
import numpy as np
def KMeans_pic_cut0(img_path,gray=False,clustercenternum=5): # Picture path , Whether to convert to grayscale image , Number of cluster centers
if gray:
img=cv2.imread(img_path,0) # grayscale
data=img.reshape(img.shape[0]*img.shape[1],1) # Pull the pictures into a column
else:
img=cv2.imread(img_path)
img=cv2.cvtColor(img,cv2.COLOR_BGR2RGB) # Turn into RGB, Otherwise plt The picture will be strange
data=img.reshape(-1,3) # Reduce 3D to 2D
print(" Start clustering ")
test=K_Means(data,clustercenternum)
# test.Visual() # It is better not to print the sample clustering process diagram , A picture with many pixels will be very, very stuck
cluster=test.cluster # Clustering results
center=test.newCenter # Cluster center
print(" Clustering complete , Start generating pictures ")
new_img=center[cluster] # A new image is constructed according to the clustering results and clustering centers
new_img=np.reshape(new_img,img.shape) # The matrix is transformed into the shape of the original picture
new_img=new_img.astype('uint8') # To become an image, the data has to be converted into uint8
if gray:
plt.subplot(121), plt.imshow(img, cmap="gray"), plt.title(" Original picture ") # plt Three channels are displayed by default , The grayscale image should be added with cmap="gray", Otherwise the picture is green ..
plt.subplot(122), plt.imshow(new_img, cmap="gray"), plt.title("KMeans,%d Cluster centers "%clustercenternum)
else :
plt.subplot(121), plt.imshow(img), plt.title(" Original picture ")
plt.subplot(122), plt.imshow(new_img), plt.title("KMeans,%d Cluster centers "%clustercenternum)
plt.show()
#plt.imsave("cutgray.jpg",new_img) # Save the picture
if __name__ == '__main__':
KMeans_pic_cut0("Mai_sakurajima.jpg",gray=False,clustercenternum=15) # The first parameter is to select the image in your current directory ,
# The bigger the picture , The larger the number of cluster centers, the slower