 def strategy(self):
# last < 0.95 *ma20 ,long position(倉位), last > ma20 *1.05, sell
if self._is_new_bar:
sum_ = 0
for item in self._Close[1:21]:
sum_ = sum_ + item
self._ma20 = sum_ / 20
if 0 == len(self._current_orders):
if self._Close[0] < 0.98 * self._ma20:
# 100000/44.28 = 2258 44.28是當前價格,10萬指的你擁有的錢
# 2258 -> 2200 shares
volume = int(100000 / self._Close[0] / 100) * 100
self._buy(self._Close[0] + 0.01, volume) # 這裡的0.01是為了防止掛單,我們需要即可買入
elif 1 == len(self._current_orders):
if self._Close[0] > self._ma20 * 1.02:
key = list(self._current_orders.keys())[0]
if self._Dt[0].date() != self._current_orders[key]['open_datetime'].date():
self._sell(key, self._Close[0] - 0.01)
print('open date is %s, close date is: %s.'
% (self._history_orders[key]['open_datetime'].date(), self._Dt[0].date()))
else:
# if sam dates, sell order aborted due to T+0 limit
print('sell order aborted due to T+0 limit')
else: # len() = 2
raise ValueError("we have more then 1 current orders")
# Close[0] in between 0.95*ma20 and 1.05*ma20,do nothing
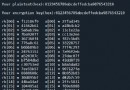
2 - 獲取T+0限制後pnl值
三、盈虧柱狀圖對比
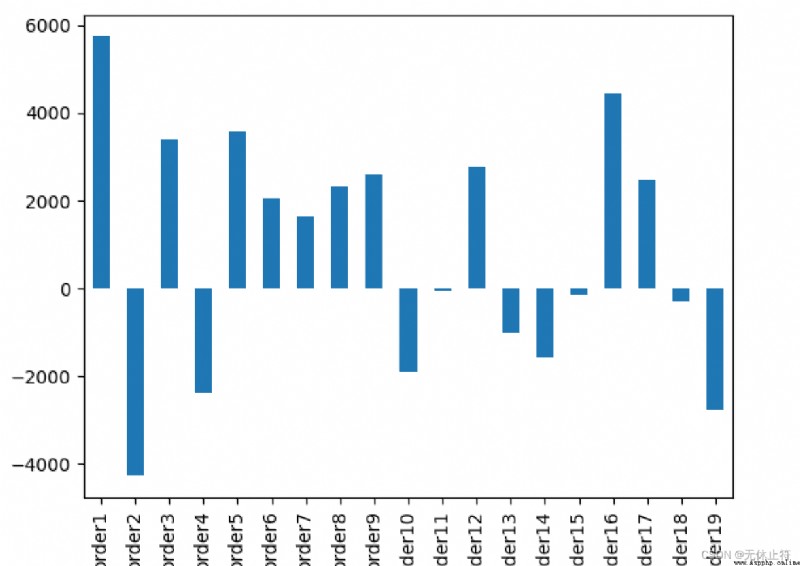
1 - 無T+0限制柱狀圖
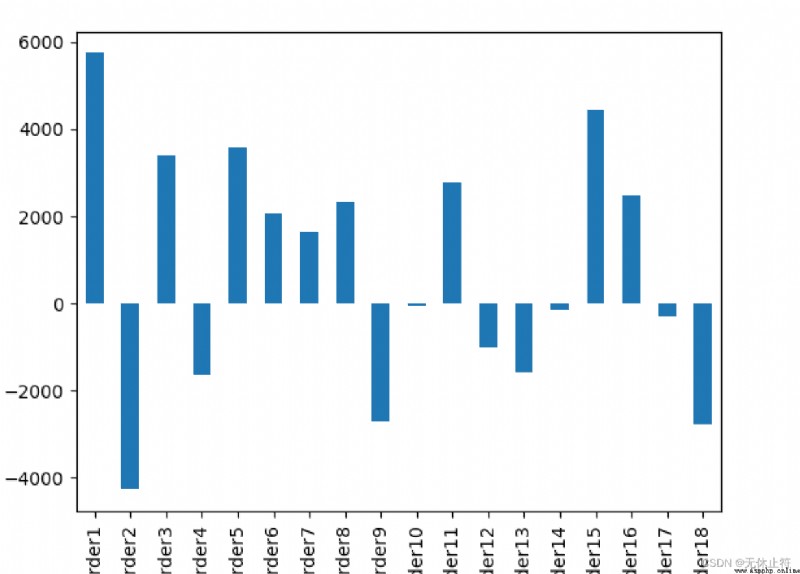
2 - T+0限制柱狀圖
四、k線圖對比
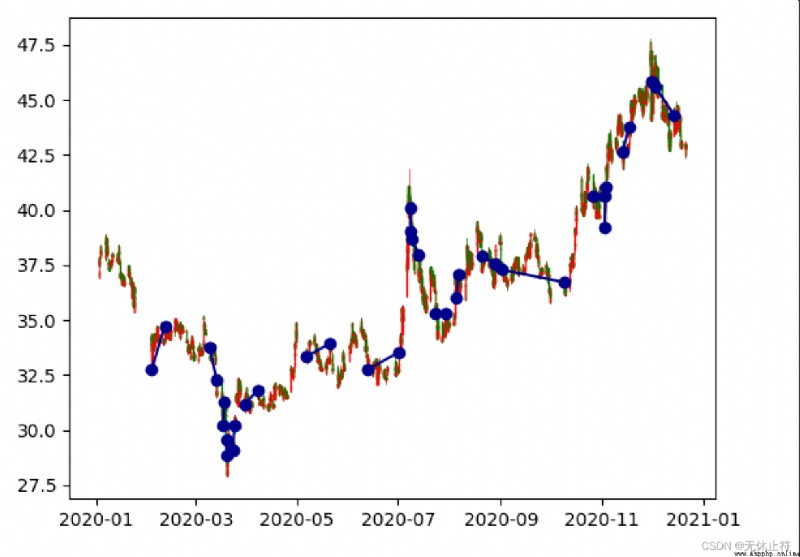
1 - 無T+0限制k線圖
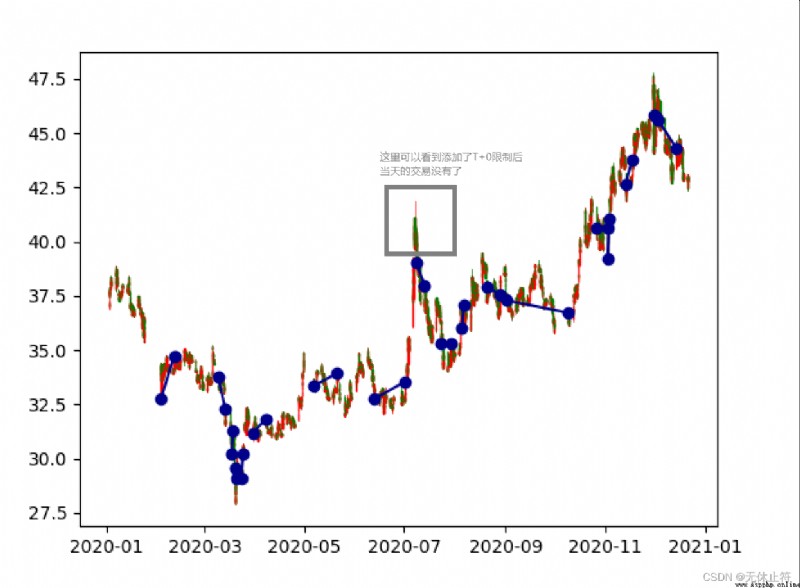
2 - T+0限制k線圖
五、完整源碼
import requests
from time import sleep
from datetime import datetime, time, timedelta
from dateutil import parser
import pandas as pd
import numpy as np
import os
import matplotlib.pyplot as plt
# import mplfinance as mpf
from mplfinance.original_flavor import candlestick_ohlc
from matplotlib.dates import date2num
def get_ticks_for_backtesting(tick_path, bar_path):
""" :func: get ticks for backtesting, need two params :param1 tick_path: 生成的回測數據路徑 csv file with tick data, when there is not tick data, use bat_path to create tick data example: "E:\\Downloads\\600036_data\\600036_ticks.csv" :param2 bar_path: 歷史數據的tick路徑 csv file with bar data, used in creating tick data example: "E:\\Downloads\\600036_data\\600036_5m.csv" :return: ticks in list with tuples in it, such as [(datetime, last_price), (datetime, last_price)] """
if os.path.exists(tick_path): # 如果已存在回測數據,直接讀取回測數據ticks
ticks = pd.read_csv(
tick_path,
parse_dates=['datetime'],
index_col='datetime'
)
tick_list = []
for index, row in ticks.iterrows():
tick_list.append((index, row[0]))
# ticks = np.array(tick_list)
ticks = tick_list
else:
bar_5m = pd.read_csv(bar_path) # 使用pandas讀取csv數據
ticks = []
for index, row in bar_5m.iterrows(): # 根據不同的開盤價設置步長
if row['open'] < 30:
step = 0.01
elif row['open'] < 60:
step = 0.03
elif row['open'] < 90:
step = 0.05
else:
step = 0.1
# in case of np.arrange(30, 30.11, 0.02), (open, high, step)
# we will not have 30.11 as the highest price,
# we might not catch high when step is more than 0.01
# that is why me need: arr = np.append(arr, row['high']) and
# arr = np.append(arr, row['low'])
arr = np.arange(row['open'], row['high'], step) # 按步長生成從open到high的數據
arr = np.append(arr, row['high']) # 這個是為了彌補步長的不對等會漏掉high
arr = np.append(arr, np.arange(row['open'] - step, row['low'], -step)) # 按步長生成從open到low的數據
arr = np.append(arr, row['low']) # 這個是為了彌補步長的不對等會漏掉low
arr = np.append(arr, row['close'])
i = 0
dt = parser.parse(row['datetime']) - timedelta(minutes=5)
for item in arr:
ticks.append((dt + timedelta(seconds=0.1 * i), item)) # 將數據時間模擬到0.1秒遞進
i += 1
tick_df = pd.DataFrame(ticks, columns=['datetime', 'price'])
tick_df.to_csv(tick_path, index=0) # 保存到csv回測數據中
return ticks
# __init__,構造,初始化,實例化
class AstockTrading(object):
""" :class: A stock trading platform, needs one param, It has backtesting, paper trading, and real trading. :param1: strategy_name: strategy_name """
def __init__(self, strategy_name):
self._strategy_name = strategy_name
self._Dt = [] # 交易時間
self._Open = [] # 開盤價
self._High = [] # 最高價
self._Low = [] # 最低價
self._Close = [] # 最新價
self._Volume = []
self._tick = [] # 數據
self._last_bar_start_minute = None # 最後一次更新bar的時間
self._is_new_bar = False # 是否有新bar
self._ma20 = None
# 當前訂單,dict, 字典
self._current_orders = {
}
# 歷史訂單
self._history_orders = {
}
self._order_number = 0
self._init = False # for backtesting
def get_tick(self):
""" :func: for paper trading or real trading, not for backtesting It goes to sina to get last tick info, address is: https://hq.sinajs.cn/list=sh600519, sh600519 can be changed need to set headers Referer to: https://finance.sina.com.cn A股的開盤時間是9:15,9:15-9:25是集合競價 -> 開盤價,9:25 9:25-9:30不交易,時間>9:30,交易開始 start this method after 9:25 tick info is organized in tuple, such as (trade_datetime, last_price), tick info is save in self._tick. :param: no param :return: None """
headers = {
'Referer': "https://finance.sina.com.cn"}
page = requests.get("https://hq.sinajs.cn/list=sh600519", headers=headers)
stock_info = page.text
mt_info = stock_info.replace("\"", "").split("=")[1].split(",")
# 最新價
last = float(mt_info[1])
trade_datetime = mt_info[30] + ' ' + mt_info[31]
self._tick = (trade_datetime, last)
def get_history_data_from_local_machine(self):
""" :not done yet :return: """
# tushare 數據來源
# self.Open = [1, 2, 3]
# self.High = [2, 3, 4]
self._Open = []
self._High = []
self._Low = []
self._Close = []
self._Dt = []
def bar_generator(self):
""" :not done yet :how save and import history data? :return: """
# assume we have history data already
# 1、update bars,calculate 5 minutes ma20 , not daily data
# 2、compare last and ma20 -> buy or sell or pass
# assume we have history data,Open,High,Low,Close,Dt
# 這裡可以是5minutes、10minutes、15minutes、20minutes、30minutes
if self._tick[0].minute % 5 == 0 and self._tick[0].minute != self._last_bar_start_minute:
self._last_bar_start_minute = self._tick[0].minute
self._Open.insert(0, self._tick[1])
self._High.insert(0, self._tick[1])
self._Low.insert(0, self._tick[1])
self._Close.insert(0, self._tick[1])
self._Dt.insert(0, self._tick[0])
self._is_new_bar = True
else:
# update current bar
self._High[0] = max(self._High[0], self._tick[1])
self._Low[0] = max(self._Low[0], self._tick[1])
self._Close[0] = self._tick[1]
self._Dt[0] = self._tick[0]
self._is_new_bar = False
def _buy(self, price, volume):
""" :method: create am order :param1 price: buying price :param2 volume: buying volume :return: none """
self._order_number += 1
key = "order" + str(self._order_number)
self._current_orders[key] = {

"open_datetime": self._Dt[0],
"open_price": price,
"volume": volume # 股數
}
pass
def _sell(self, key, price):
""" :method: close a long order, It needs two params :param1 key: long order's key :param2 price: selling price :return: """
self._current_orders[key]['close_price'] = price
self._current_orders[key]['close_datetime'] = self._Dt[0]
self._current_orders[key]['pnl'] = \
(price - self._current_orders[key]['open_price']) \
* self._current_orders[key]['volume'] \
- price * self._current_orders[key]['volume'] * 1 / 1000 \
- (price - self._current_orders[key]['open_price']) \
* self._current_orders[key]['volume'] * 3 / 10000
# move order from current orders to history orders
self._history_orders[key] = self._current_orders.pop(key)
def strategy(self):
# last < 0.95 *ma20 ,long position(倉位), last > ma20 *1.05, sell
if self._is_new_bar:
sum_ = 0
for item in self._Close[1:21]:
sum_ = sum_ + item
self._ma20 = sum_ / 20
if 0 == len(self._current_orders):
if self._Close[0] < 0.98 * self._ma20:
# 100000/44.28 = 2258 44.28是當前價格,10萬指的你擁有的錢
# 2258 -> 2200 shares
volume = int(100000 / self._Close[0] / 100) * 100
self._buy(self._Close[0] + 0.01, volume) # 這裡的0.01是為了防止掛單,我們需要即可買入
elif 1 == len(self._current_orders):
if self._Close[0] > self._ma20 * 1.02:
key = list(self._current_orders.keys())[0]
if self._Dt[0].date() != self._current_orders[key]['open_datetime'].date():
self._sell(key, self._Close[0] - 0.01)
print('open date is %s, close date is: %s.'
% (self._history_orders[key]['open_datetime'].date(), self._Dt[0].date()))
else:
# if sam dates, sell order aborted due to T+0 limit
print('sell order aborted due to T+0 limit')
else: # len() = 2
raise ValueError("we have more then 1 current orders")
# Close[0] in between 0.95*ma20 and 1.05*ma20,do nothing
def bar_generator_for_backtesting(self, tick):
""" :method: for backtesting only, used to update _Open, _ High, etc, It needs just one param :param tick: tick info in tuple, (datetime, price) :return: """
if tick[0].minute % 5 == 0 and tick[0].minute != self._last_bar_start_minute:
self._last_bar_start_minute = tick[0].minute
self._Open.insert(0, tick[1])
self._High.insert(0, tick[1])
self._Low.insert(0, tick[1])
self._Close.insert(0, tick[1])
self._Dt.insert(0, tick[0])
self._is_new_bar = True
else:
# update current bar
self._High[0] = max(self._High[0], tick[1])
self._Low[0] = max(self._Low[0], tick[1])
self._Close[0] = tick[1]
self._Dt[0] = tick[0]
self._is_new_bar = False
def run_backtestting(self, ticks):
""" :method: ticks will be used to generate bars, when bars is long enough, call strategy() :param ticks: list with (datetime, price) in the list :return: none """
for tick in ticks:
self.bar_generator_for_backtesting(tick)
if self._init:
self.strategy()
else:
if len(self._Open) >= 100:
self._init = True
self.strategy()
# ma = AstockTrading('600036') # 類實例化
# ma.get_history_data_from_local_machine()
#
# # 交易時間是9:30-11:30,13:00-15:00
# while time(9, 26) < datetime.now().time() < time(11, 32) \
# or time(13) < datetime.now().time() < time(15, 2):
# ma.get_tick()
# ma.bar_generator()
# ma.strategy()
# # trade_time = parser.parse(ma._tick[0]).time()
# # sleep(3)
if __name__ == '__main__':
tick_path = "E:\\Downloads\\600036_data\\600036_ticks.csv"
bar_path = "E:\\Downloads\\600036_data\\600036_5m.csv"
ticks = get_ticks_for_backtesting(tick_path, bar_path) # 獲取回測數據
ast = AstockTrading('ma')
ast.run_backtestting(ticks) # 運行回測數據
print('ast._current_orders:')
print(ast._current_orders)
print("-------------------------------------")
print('ast._history_orders:')
print(ast._history_orders)
# 使用matplotlib繪制盈虧柱狀圖
profit_orders = 0 # 盈利的交易數
loss_orders = 0 # 虧損的交易數
orders = ast._history_orders
for key in orders.keys():
if orders[key]['pnl'] >= 0:
profit_orders += 1
else:
loss_orders += 1
win_rate = profit_orders / len(orders)
loss_rate = loss_orders / len(orders)
# T = transpose
orders_df = pd.DataFrame(orders).T
orders_df.loc[:, 'pnl'].plot.bar()
plt.show()
# print sum of pnl
print('sum of pnl is: ' + str(orders_df.loc[:, 'pnl'].sum()))
# 使用 mplfinance 繪制k線圖:訂單交易價格與時間
bar5 = pd.read_csv(bar_path, parse_dates=['datetime'])
bar5.loc[:, 'datetime'] = [date2num(x) for x in bar5.loc[:, 'datetime']]
fig, ax = plt.subplots()
candlestick_ohlc(
ax,
quotes=bar5.values,
width=0.2,
colorup="r",
colordown='g',
alpha=1.0,
)
# put orders in candle sticks
for index, row in orders_df.iterrows():
ax.plot(
[row['open_datetime'], row['close_datetime']],
[row['open_price'], row['close_price']],
color='darkblue',
marker='o',
)
plt.show()