6. Python quantitative trading - single average strategy upgrade 1:t+0 limit
編輯:Python
Catalog
Preface
T+0 Limit implementation ideas
One 、 Adjust the proportion of buying and selling and make statistics pnl
1 - stay main Add statistics to pnl
2 - Adjust the buying ratio 0.98, Selling ratio 1.02
3 - obtain pnl value
Two 、 Policy add T+0 Limit
1 - T+0 Realization
2 - obtain T+0 After restriction pnl value
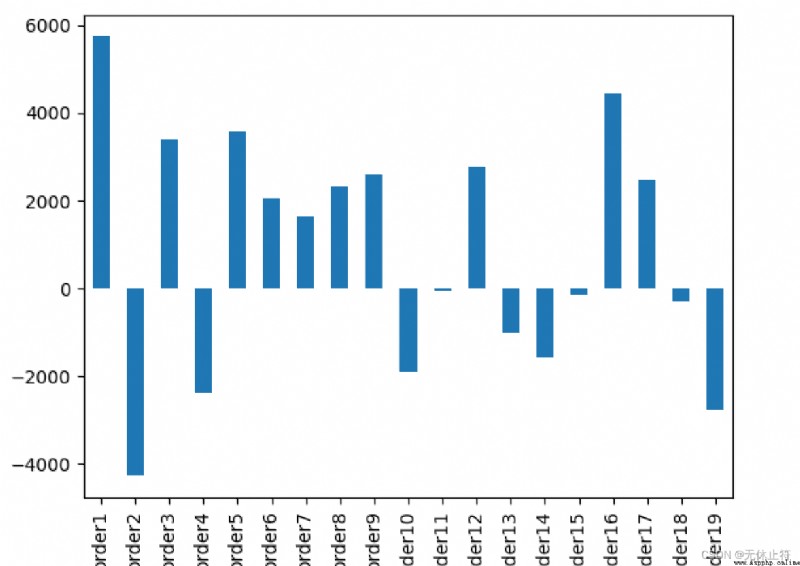
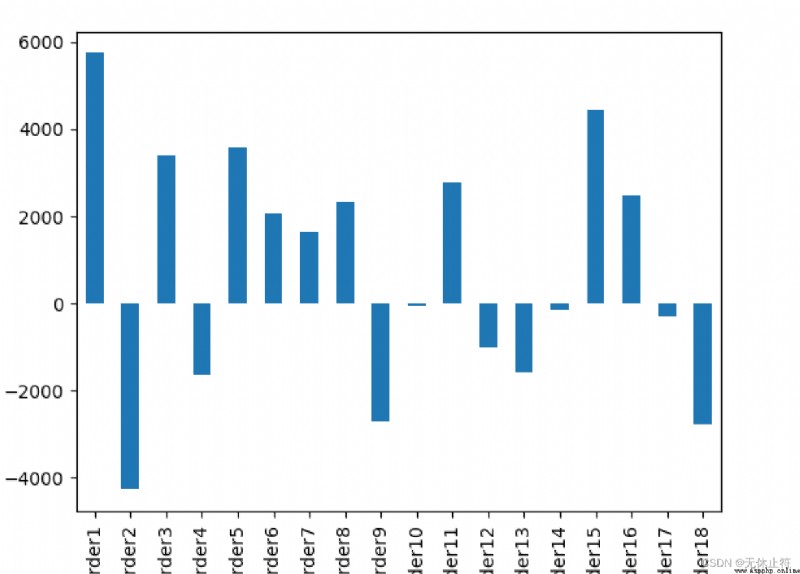
3、 ... and 、 Profit and loss histogram comparison
1 - nothing T+0 Limit histogram
2 - T+0 Limit histogram
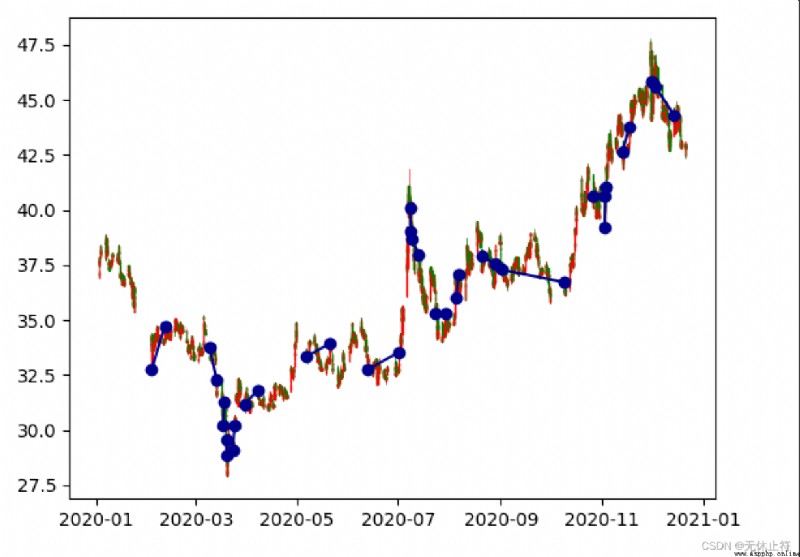
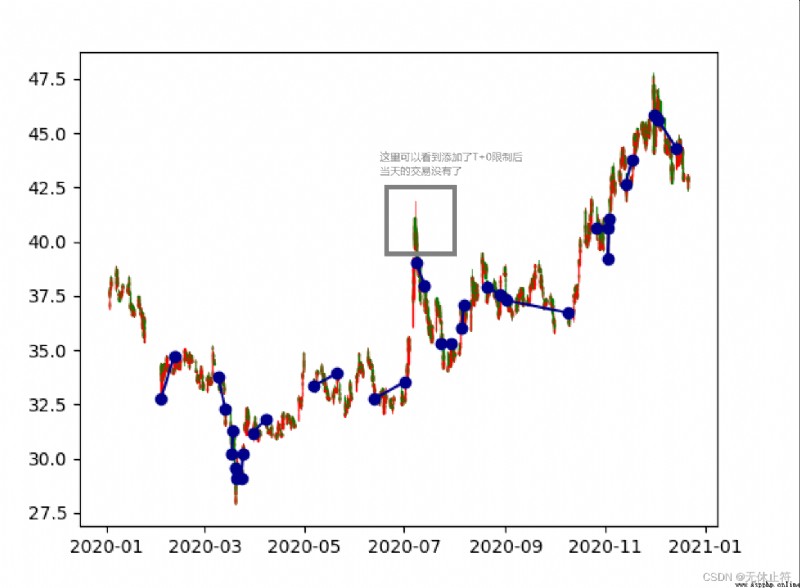
Four 、k Line graph comparison
1 - nothing T+0 Limit k Line graph
2 - T+0 Limit k Line graph
5、 ... and 、 Complete source code
Preface
We have completed the back test before , But our strategy is ma20 Single average strategy , This kind of strategy is too single and the profit is not high
We need to upgrade the single average strategy of the regression strategy
add to T+0 Trading restrictions
Buying needs to be upgraded to 2 Second judgment , Do some cumulative calculations below the moving average
T+0 Limit implementation ideas
In fact, in the sell Method to add the date judgment
One 、 Adjust the proportion of buying and selling and make statistics pnl
1 - stay main Add statistics to pnl
if __name__ == '__main__':
# Omit ...
# T = transpose
orders_df = pd.DataFrame(orders).T
orders_df.loc[:, 'pnl'].plot.bar()
plt.show()
# print sum of pnl
print('sum of pnl is: ' + str(orders_df.loc[:, 'pnl'].sum()))
# Use mplfinance draw k Line graph : Order transaction price and time
bar5 = pd.read_csv(bar_path, parse_dates=['datetime'])
bar5.loc[:, 'datetime'] = [date2num(x) for x in bar5.loc[:, 'datetime']]
# Omit ...
2 - Adjust the buying ratio 0.98, Selling ratio 1.02
 def strategy(self):
# last < 0.95 *ma20 ,long position( Position ), last > ma20 *1.05, sell
if self._is_new_bar:
sum_ = 0
for item in self._Close[1:21]:
sum_ = sum_ + item
self._ma20 = sum_ / 20
if 0 == len(self._current_orders):
if self._Close[0] < 0.98 * self._ma20:
# 100000/44.28 = 2258 44.28 Is the current price ,10 The money you have
# 2258 -> 2200 shares
volume = int(100000 / self._Close[0] / 100) * 100
self._buy(self._Close[0] + 0.01, volume) # there 0.01 In order to prevent pending orders , We can buy whatever we need
elif 1 == len(self._current_orders):
if self._Close[0] > self._ma20 * 1.02:
key = list(self._current_orders.keys())[0]
self._sell(key, self._Close[0] - 0.01)
# Omit ...
3 - obtain pnl value
Two 、 Policy add T+0 Limit
1 - T+0 Realization
 def strategy(self):
# last < 0.95 *ma20 ,long position( Position ), last > ma20 *1.05, sell
if self._is_new_bar:
sum_ = 0
for item in self._Close[1:21]:
sum_ = sum_ + item
self._ma20 = sum_ / 20
if 0 == len(self._current_orders):
if self._Close[0] < 0.98 * self._ma20:
# 100000/44.28 = 2258 44.28 Is the current price ,10 The money you have
# 2258 -> 2200 shares
volume = int(100000 / self._Close[0] / 100) * 100
self._buy(self._Close[0] + 0.01, volume) # there 0.01 In order to prevent pending orders , We can buy whatever we need
elif 1 == len(self._current_orders):
if self._Close[0] > self._ma20 * 1.02:
key = list(self._current_orders.keys())[0]
if self._Dt[0].date() != self._current_orders[key]['open_datetime'].date():
self._sell(key, self._Close[0] - 0.01)
print('open date is %s, close date is: %s.'
% (self._history_orders[key]['open_datetime'].date(), self._Dt[0].date()))
else:
# if sam dates, sell order aborted due to T+0 limit
print('sell order aborted due to T+0 limit')
else: # len() = 2
raise ValueError("we have more then 1 current orders")
# Close[0] in between 0.95*ma20 and 1.05*ma20,do nothing
2 - obtain T+0 After restriction pnl value
3、 ... and 、 Profit and loss histogram comparison
1 - nothing T+0 Limit histogram
2 - T+0 Limit histogram
Four 、k Line graph comparison
1 - nothing T+0 Limit k Line graph
2 - T+0 Limit k Line graph
5、 ... and 、 Complete source code
import requests
from time import sleep
from datetime import datetime, time, timedelta
from dateutil import parser
import pandas as pd
import numpy as np
import os
import matplotlib.pyplot as plt
# import mplfinance as mpf
from mplfinance.original_flavor import candlestick_ohlc
from matplotlib.dates import date2num
def get_ticks_for_backtesting(tick_path, bar_path):
""" :func: get ticks for backtesting, need two params :param1 tick_path: Generated backtest data path csv file with tick data, when there is not tick data, use bat_path to create tick data example: "E:\\Downloads\\600036_data\\600036_ticks.csv" :param2 bar_path: Of historical data tick route csv file with bar data, used in creating tick data example: "E:\\Downloads\\600036_data\\600036_5m.csv" :return: ticks in list with tuples in it, such as [(datetime, last_price), (datetime, last_price)] """
if os.path.exists(tick_path): # If back test data already exists , Read back test data directly ticks
ticks = pd.read_csv(
tick_path,
parse_dates=['datetime'],
index_col='datetime'
)
tick_list = []
for index, row in ticks.iterrows():
tick_list.append((index, row[0]))
# ticks = np.array(tick_list)
ticks = tick_list
else:
bar_5m = pd.read_csv(bar_path) # Use pandas Read csv data
ticks = []
for index, row in bar_5m.iterrows(): # Set the step size according to different opening prices
if row['open'] < 30:
step = 0.01
elif row['open'] < 60:
step = 0.03
elif row['open'] < 90:
step = 0.05
else:
step = 0.1
# in case of np.arrange(30, 30.11, 0.02), (open, high, step)
# we will not have 30.11 as the highest price,
# we might not catch high when step is more than 0.01
# that is why me need: arr = np.append(arr, row['high']) and
# arr = np.append(arr, row['low'])
arr = np.arange(row['open'], row['high'], step) # Generate from... In steps open To high The data of
arr = np.append(arr, row['high']) # This is to make up for the missing step size high
arr = np.append(arr, np.arange(row['open'] - step, row['low'], -step)) # Generate from... In steps open To low The data of
arr = np.append(arr, row['low']) # This is to make up for the missing step size low
arr = np.append(arr, row['close'])
i = 0
dt = parser.parse(row['datetime']) - timedelta(minutes=5)
for item in arr:
ticks.append((dt + timedelta(seconds=0.1 * i), item)) # Simulate the data time to 0.1 Second progressive
i += 1
tick_df = pd.DataFrame(ticks, columns=['datetime', 'price'])
tick_df.to_csv(tick_path, index=0) # Save to csv Back test data
return ticks
# __init__, structure , initialization , Instantiation
class AstockTrading(object):
""" :class: A stock trading platform, needs one param, It has backtesting, paper trading, and real trading. :param1: strategy_name: strategy_name """
def __init__(self, strategy_name):
self._strategy_name = strategy_name
self._Dt = [] # Trading hours
self._Open = [] # Opening price
self._High = [] # Highest price
self._Low = [] # The lowest price
self._Close = [] # The latest price
self._Volume = []
self._tick = [] # data
self._last_bar_start_minute = None # Last update bar Time for
self._is_new_bar = False # Whether there are new bar
self._ma20 = None
# Current order ,dict, Dictionaries
self._current_orders = {
}
# Historical orders
self._history_orders = {
}
self._order_number = 0
self._init = False # for backtesting
def get_tick(self):
""" :func: for paper trading or real trading, not for backtesting It goes to sina to get last tick info, address is: https://hq.sinajs.cn/list=sh600519, sh600519 can be changed need to set headers Referer to: https://finance.sina.com.cn A The opening time of the shares is 9:15,9:15-9:25 It's call auction -> Opening price ,9:25 9:25-9:30 Don't trade , Time >9:30, The deal begins start this method after 9:25 tick info is organized in tuple, such as (trade_datetime, last_price), tick info is save in self._tick. :param: no param :return: None """
headers = {
'Referer': "https://finance.sina.com.cn"}
page = requests.get("https://hq.sinajs.cn/list=sh600519", headers=headers)
stock_info = page.text
mt_info = stock_info.replace("\"", "").split("=")[1].split(",")
# The latest price
last = float(mt_info[1])
trade_datetime = mt_info[30] + ' ' + mt_info[31]
self._tick = (trade_datetime, last)
def get_history_data_from_local_machine(self):
""" :not done yet :return: """
# tushare Data sources
# self.Open = [1, 2, 3]
# self.High = [2, 3, 4]
self._Open = []
self._High = []
self._Low = []
self._Close = []
self._Dt = []
def bar_generator(self):
""" :not done yet :how save and import history data? :return: """
# assume we have history data already
# 1、update bars,calculate 5 minutes ma20 , not daily data
# 2、compare last and ma20 -> buy or sell or pass
# assume we have history data,Open,High,Low,Close,Dt
# This could be 5minutes、10minutes、15minutes、20minutes、30minutes
if self._tick[0].minute % 5 == 0 and self._tick[0].minute != self._last_bar_start_minute:
self._last_bar_start_minute = self._tick[0].minute
self._Open.insert(0, self._tick[1])
self._High.insert(0, self._tick[1])
self._Low.insert(0, self._tick[1])
self._Close.insert(0, self._tick[1])
self._Dt.insert(0, self._tick[0])
self._is_new_bar = True
else:
# update current bar
self._High[0] = max(self._High[0], self._tick[1])
self._Low[0] = max(self._Low[0], self._tick[1])
self._Close[0] = self._tick[1]
self._Dt[0] = self._tick[0]
self._is_new_bar = False
def _buy(self, price, volume):
""" :method: create am order :param1 price: buying price :param2 volume: buying volume :return: none """
self._order_number += 1
key = "order" + str(self._order_number)
self._current_orders[key] = {

"open_datetime": self._Dt[0],
"open_price": price,
"volume": volume # Number of shares
}
pass
def _sell(self, key, price):
""" :method: close a long order, It needs two params :param1 key: long order's key :param2 price: selling price :return: """
self._current_orders[key]['close_price'] = price
self._current_orders[key]['close_datetime'] = self._Dt[0]
self._current_orders[key]['pnl'] = \
(price - self._current_orders[key]['open_price']) \
* self._current_orders[key]['volume'] \
- price * self._current_orders[key]['volume'] * 1 / 1000 \
- (price - self._current_orders[key]['open_price']) \
* self._current_orders[key]['volume'] * 3 / 10000
# move order from current orders to history orders
self._history_orders[key] = self._current_orders.pop(key)
def strategy(self):
# last < 0.95 *ma20 ,long position( Position ), last > ma20 *1.05, sell
if self._is_new_bar:
sum_ = 0
for item in self._Close[1:21]:
sum_ = sum_ + item
self._ma20 = sum_ / 20
if 0 == len(self._current_orders):
if self._Close[0] < 0.98 * self._ma20:
# 100000/44.28 = 2258 44.28 Is the current price ,10 The money you have
# 2258 -> 2200 shares
volume = int(100000 / self._Close[0] / 100) * 100
self._buy(self._Close[0] + 0.01, volume) # there 0.01 In order to prevent pending orders , We can buy whatever we need
elif 1 == len(self._current_orders):
if self._Close[0] > self._ma20 * 1.02:
key = list(self._current_orders.keys())[0]
if self._Dt[0].date() != self._current_orders[key]['open_datetime'].date():
self._sell(key, self._Close[0] - 0.01)
print('open date is %s, close date is: %s.'
% (self._history_orders[key]['open_datetime'].date(), self._Dt[0].date()))
else:
# if sam dates, sell order aborted due to T+0 limit
print('sell order aborted due to T+0 limit')
else: # len() = 2
raise ValueError("we have more then 1 current orders")
# Close[0] in between 0.95*ma20 and 1.05*ma20,do nothing
def bar_generator_for_backtesting(self, tick):
""" :method: for backtesting only, used to update _Open, _ High, etc, It needs just one param :param tick: tick info in tuple, (datetime, price) :return: """
if tick[0].minute % 5 == 0 and tick[0].minute != self._last_bar_start_minute:
self._last_bar_start_minute = tick[0].minute
self._Open.insert(0, tick[1])
self._High.insert(0, tick[1])
self._Low.insert(0, tick[1])
self._Close.insert(0, tick[1])
self._Dt.insert(0, tick[0])
self._is_new_bar = True
else:
# update current bar
self._High[0] = max(self._High[0], tick[1])
self._Low[0] = max(self._Low[0], tick[1])
self._Close[0] = tick[1]
self._Dt[0] = tick[0]
self._is_new_bar = False
def run_backtestting(self, ticks):
""" :method: ticks will be used to generate bars, when bars is long enough, call strategy() :param ticks: list with (datetime, price) in the list :return: none """
for tick in ticks:
self.bar_generator_for_backtesting(tick)
if self._init:
self.strategy()
else:
if len(self._Open) >= 100:
self._init = True
self.strategy()
# ma = AstockTrading('600036') # Class instantiation
# ma.get_history_data_from_local_machine()
#
# # The trading time is 9:30-11:30,13:00-15:00
# while time(9, 26) < datetime.now().time() < time(11, 32) \
# or time(13) < datetime.now().time() < time(15, 2):
# ma.get_tick()
# ma.bar_generator()
# ma.strategy()
# # trade_time = parser.parse(ma._tick[0]).time()
# # sleep(3)
if __name__ == '__main__':
tick_path = "E:\\Downloads\\600036_data\\600036_ticks.csv"
bar_path = "E:\\Downloads\\600036_data\\600036_5m.csv"
ticks = get_ticks_for_backtesting(tick_path, bar_path) # Get back test data
ast = AstockTrading('ma')
ast.run_backtestting(ticks) # Run back test data
print('ast._current_orders:')
print(ast._current_orders)
print("-------------------------------------")
print('ast._history_orders:')
print(ast._history_orders)
# Use matplotlib Draw a profit and loss histogram
profit_orders = 0 # Number of profitable transactions
loss_orders = 0 # Number of loss making transactions
orders = ast._history_orders
for key in orders.keys():
if orders[key]['pnl'] >= 0:
profit_orders += 1
else:
loss_orders += 1
win_rate = profit_orders / len(orders)
loss_rate = loss_orders / len(orders)
# T = transpose
orders_df = pd.DataFrame(orders).T
orders_df.loc[:, 'pnl'].plot.bar()
plt.show()
# print sum of pnl
print('sum of pnl is: ' + str(orders_df.loc[:, 'pnl'].sum()))
# Use mplfinance draw k Line graph : Order transaction price and time
bar5 = pd.read_csv(bar_path, parse_dates=['datetime'])
bar5.loc[:, 'datetime'] = [date2num(x) for x in bar5.loc[:, 'datetime']]
fig, ax = plt.subplots()
candlestick_ohlc(
ax,
quotes=bar5.values,
width=0.2,
colorup="r",
colordown='g',
alpha=1.0,
)
# put orders in candle sticks
for index, row in orders_df.iterrows():
ax.plot(
[row['open_datetime'], row['close_datetime']],
[row['open_price'], row['close_price']],
color='darkblue',
marker='o',
)
plt.show()