引言
在客戶使用 WebSphere Application Server 時可能遇到這樣的問題,同一台物理主機上的一 個 server 工作正常,而另一個 server 卻不能正常啟動,這可能是因為多個 server 間端口沖突引起的。 Profile Port Checker 是 IBM 提供的一款免費的工具,用於提供沖突端口檢測的服務。本文將詳細介紹 Profile Port Checker 的安裝過程,以及各個命令的功能,並利用實例來展示如何使用 Profile Port Checker 來檢測實際環境中的端口沖突。
IBM Serviceability 工具概述
除了提供高質量的產 品以外,為了進一步完善產品的客戶體驗,並且給客戶提供更好的支持服務,IBM 也推出了一系列工具,致力 於簡便地監控和快速地解決客戶在使用 IBM 產品過程中遇到的各種問題。這些工具統稱為 IBM Serviceability 工具,這些工具從各個角度提供了對產品的技術支持,比如 IBM Visual Configuration Explorer (VCE) [1] 關注產品在配置方面的問題,IBM Database Connection Pool Analyzer for WebSphere Application Server [2] 關注於 WebSphere Application Server 產品中 Java?Database Connectivity (JDBC) connection pools 相關的問題,而我們這裡要介紹的 Profile Port Checker 則關注於安裝 WebSphere Application Server 產品時的端口沖突問題。
IBM Serviceability 工具中的一部分以插 件的形式整合進了 IBM Support Assistant [3] 產品中,還有一部分需要獨立下載、安裝和運行。截至 IBM Support Assistant 4.1 版本,Profile Port Checker 還沒有被整合進 IBM Support Assistant 工具中,而 是獨立運行。
在本文中,我們將在一個包含多個 WebSphere Application Server profile 的實驗主 機上,演示 Profile Port Checker 的用法,展示如何輕松獲得多個 profiles 上多個應用服務器占用端口的 列表以及定位應用服務器之間發生沖突的端口。
安裝准備
在開始實例演示之前,您首先需要下 載 Profile Port Checker,並且了解它適用的情況。
下載 Profile Port Checker
Profile Port Checker 是一款免費的 IBM Serviceability 工具,您可以在參考資源 [4] 中下載 Profile Port Checker 的壓縮包。解壓縮後無需安裝,可以直接通過命令行的形式運行。
適用情況
Profile Port Checker 適用於同一個物理主機上,包含多個 WebSphere Application Server 的 profile,以及多個 應用服務器的情況。這個工具會掃描該台物理主機上,每個 WebSphere Application Server profile 上的每 個應用服務器所占用的端口,並整合成報告信息。報告中除了會詳細列出每個被占用的端口之外,如果發現了 沖突,也會指出發生沖突的應用服務器及沖突的端口。
Profile Port Checker 會搜索該機器上所有 WebSphere Application Server Profile 的安裝路徑,搜索主要是依據 profile 的注冊文件,例如在 Windows 系統上,該文件位於 C:\WINDOWS\.nifregistry。另外該文件的路徑信息也可以在 WebSphere Application Server 的安裝目錄中的 NIFRegistry.properties 文件中找到,例如,在 Windows 系統上,該 文件位於 C:\Program Files\IBM\WebSphere\AppServer7\properties\NIFRegistry.properties。
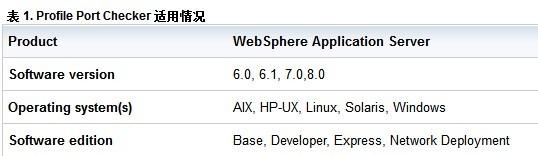
Profile Port Checker 適用情況如表 1 所示:
需要注意以 下兩點:
Profile Port Checker 除了可以檢測獨立安裝的 WebSphere Application Server,也可以檢測隨其他產 品安裝的 WebSphere Application Server 的 profile,比如說在 IBM?Rational?Software Delivery Platform 安裝時集成安裝的 WebSphere Application Server 所對應的 profile,它通常位於 Rational 產 品安裝目錄 runtimes 文件夾下。
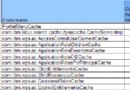
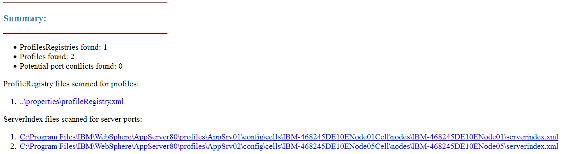
Profile Port Checker 可以用來掃描和檢測同一台機器上不同版本 WebSphere Application Server 的 profile,但是目前不支持同時掃描 WebSphere Application Server V8.0 和其他版的 WebSphere Application Server 所對應的 profile。例如,實驗機器上同時安裝了 WebSphere Application Server V6.1,WebSphere Application Server V7.0 和 WebSphere Application Server V8.0。如果我們在 WebSphere Application Server V8.0 的安裝目錄上運行 Profile Port Checker,只能掃描出 WebSphere Application Server V8.0 的 profile,而不能掃描出 WebSphere Application Server V6.1 和 WebSphere Application Server V7.0 的 profile。如圖 1 所示,圖 1 截取自 Profile Port Checker 掃描報告,完整 的掃描報告請參考下載資源 [1].
圖 1. Profile Port Checker 掃描 WAS V8 報告
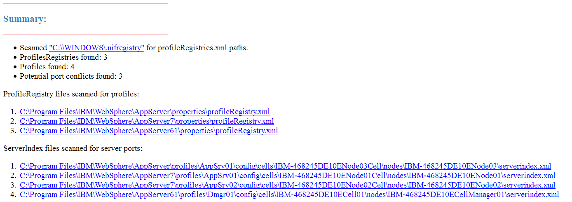
如果在 WebSphere Application Server V7.0 的安裝目錄或者 WebSphere Application Server V6.1 上運行 Profile Port Checker,則只能 掃描出 WebSphere Application Server V7.0 和 WebSphere Application Server V6.1 的 profile,而不能 掃描出和 WebSphere Application Server V8.0 的 profile。如圖 2 所示,圖 2 截取自 Profile Port Checker 掃描報告,完整的掃描報告請參考下載資源 [2].
圖 2. Profile Port Checker 掃描 WAS V7.0 和 WAS V6.1 報告
命令詳解
運行 Profile Port Checker 的方式很簡單,只需要將 Profile Port Checker 解壓到 WebSphere Application Server 安裝目錄下的 bin 目錄中,再運行下面這條命令即可:
java -jar profilePortChecker.jar [parameters]
其中 parameters 主要有以下三類:
系統參數
-l 列出當前系統上 WebSphere Application Server 的每一個 profile 上定義的每個應用服 務器所占用的端口。
-c 列出當前系統上 WebSphere Application Server 的每一個 profile 上定 義的每個應用服務器所占用的端口 , 並且報告應用服務器之間端口沖突情況。
-cd Profile Port Checker 除了可以掃描系統上安裝的 WebSphere Application Server Profiles 以外,還可以掃描通過 IBM Support Assistant 工具收集上來的系統信息,通常這些信息是以 jar 文件的形式存放的。這個命令與 -c 的基本功能是相同的,差別在於 -c 會在系統上搜索 WebSphere Application Server 的 profile 信息,而 -cd 則是在 */profile/<profileName> 目錄中搜索 IBM Support Assistant 工具收集上來的系統信息 jar 文件中包含的 WebSphere Application Server profile 的信息。
文件參數
-f 這 個參數可以指定去掃描 IBM Support Assistant 工具收集上來的系統信息的 jar 文件中 WebSphere Application Server 的 profile 信息,而不是當前的系統中 WebSphere Application Server 的 profile 信息,使用這個參數時需要指定該 jar 文件的路徑。
輸出參數
-d 指定輸出文 件的存放路徑
-csv 輸出文件以 csv 格式存放,默認存放成文本格式的 log 文件。
-html 輸出文件以 html 格式存放,默認存放成文本格式的 log 文件。
將這些參數整合在一起,以下列出了常用的命令 用法供您參考:
profilePortChecker [-l] [[-html] || [-csv]]
掃描當前系統上所有的 WebSphere Application Server 的 profile 所占用的端口,並以 html 或 csv 的格式生成報告。
profilePortChecker [-c] [-html]
掃描當前系統上所有的 WebSphere Application Server 的 profile 所占用的端口並檢測定位端口沖突,並以 html 的格式生成報告。
profilePortChecker [-cd "/profileName/config"] [-d output_path] [-html]
掃描 "/profileName/config"目錄下的由 IBM Support Assistant 工具收集上來的系統信息的 jar 文 件,並在 output_path 目錄下生成 html 格式的報告,報告中包含該系統上所有的 WebSphere Application Server 的 profile 所占用的端口並定位端口沖突信息。
profilePortChecker [-f "/path/collector.jar"] [-d output_path] [-html]
掃描由 IBM Support Assistant 收集上來的系統信息文件 /path/collector.jar 中所包含的 WebSphere Application Server profiles 信息,並在 output_path 目錄下生成 html 格式的報告。
使用實例
下面我們通過兩個實際的例子來展示一下 Profile Port Checker 的使用方式:
實例 1:利用 Profile Port Checker 掃描及檢測多版本 WebSphere Application Server 間的端口沖突。
在實例 1 中,我們的實驗機器上,安裝有 WebSphere Application Server V6.1, WebSphere Application Server V7.0。一共有 4 個 profile, 1 個來自 WebSphere Application Server V6.1, 其他 3 個來自於 WebSphere Application Server V7.0。
步驟 1: 將 Profile Port Checker 的安裝包解壓 到 WebSphere Application Server V6.1 安裝路徑
C:\Program Files\IBM\WebSphere\AppServer61 \bin 下(或者 C:\Program Files\IBM\WebSphere\AppServer7\bin 下,結果是一樣的)。您將看到以下三個 文件:run_profilePortChecker.bat,run_profilePortChecker.sh 以及 profilePortChecker.jar
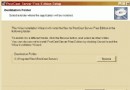
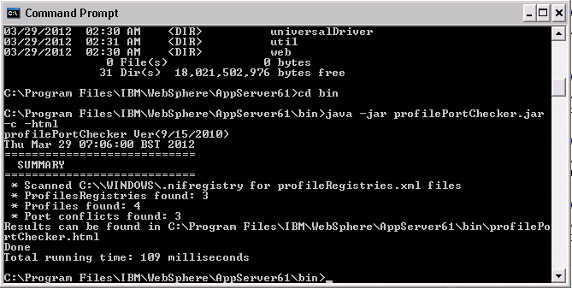
步驟 2: 運行命令 java -jar profilePortChecker.jar – c – html 來掃描端口占用情況 並定位沖突端口,控制台信息如圖 3 所示:
圖 3. 實例 1 Profile Port Checker 運行控制台信息
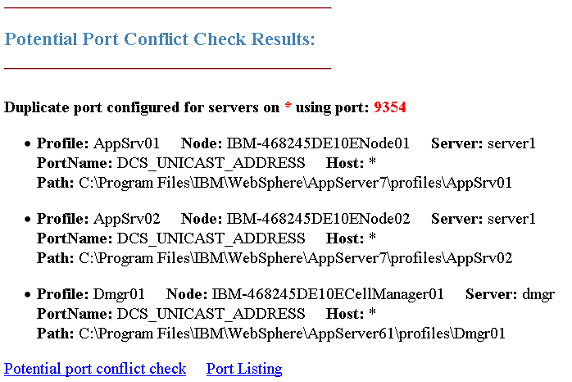
步驟 3: 檢查掃描報告 C:\Program Files\IBM\WebSphere\AppServer61 \bin\profilePortChecker.html,端口沖突報告截圖如圖 4:
圖 4. 實例 1 Profile Port Checker 端口沖突報告
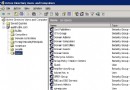
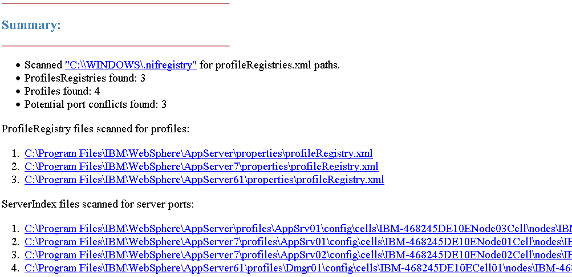
掃描結果報告截圖如圖 5 所示:
圖 5. 實例 1 Profile Port Checker 掃描報告
從報告中我們可以看到端口 9354 沖突,三個 profile 都分別占用該端口,為了解決端口沖突問題,我們可以通過 WebSphere Application Server 的管理控制台更新端口以解決該問題。
實例 2:利用 Profile Port Checker 掃描 WebSphere Application Server V8.0 多個 profile 間的端口沖突。
在實例 2 中,我們的實驗機器上,安裝有 WebSphere Application Server V8.0,以及 2 個 WebSphere Application Server V8.0 的 profile。
步驟 1: 將 Profile Port Checker 的安裝包解壓到 WebSphere Application Server V8.0 安裝路 徑
C:\Program Files\IBM\WebSphere\AppServer80\bin 下。您將看到以下三個文件: run_profilePortChecker.bat,run_profilePortChecker.sh 以及 profilePortChecker.jar
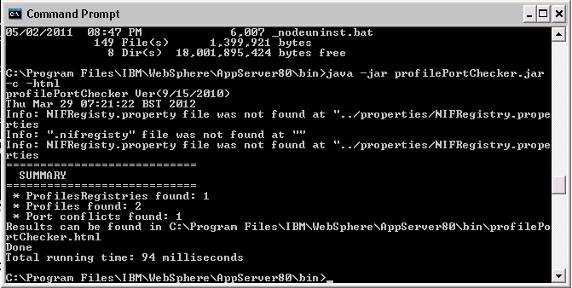
步驟 2: 運行命令 java -jar profilePortChecker.jar – c – html 來掃描端口占用情況並定位 沖突的端口,控制台信息如圖 6 所示:
圖 6. 實例 2 Profile Port Checker 運行控制台信息
需要注意的是:
控制台中出現這樣的信息 "NIFRegisty.property file was not found at ..",是因為從 WebSphere Application Server V8.0 開始,移除了 NIFRegisty.property 這個文件, 並且在創建 WebSphere Application Server V8.0 的 profile 時,也不會像之前版本的 WebSphere Application Server 產品一樣,將 profile 的信息注冊在機器上的 profile 文件中(如 C:\WINDOWS\.nifregistry)。但是這並不影響 Profile Port Checker 正常掃描 WebSphere Application Server V8.0 的 profile 端口占用情況。
步驟 3:C:\Program Files\IBM\WebSphere\AppServer80\bin\profilePortChecker.html,端口沖突報告 截圖如圖 7:
圖 7. 實例 2 Profile Port Checker 端口沖突報告
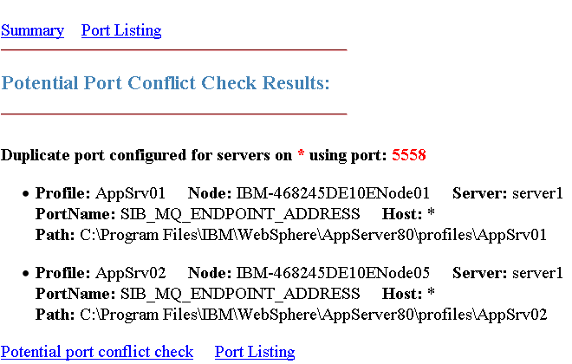
從報告中我們可以看到端口 5558 沖突,需要通過 WebSphere Application Server 的管理控制台更新端口以解決該端口沖突問題。
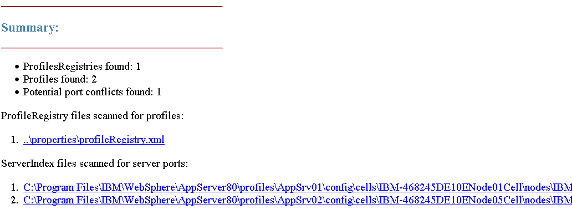
掃 描結果報告截圖如圖 8:
圖 8. 實例 2 Profile Port Checker 掃描報告
結束語
本文通過兩個實例,介紹了 Profile Port Checker 的特性,適用情況及使用方式,為讀者 檢測定位 WebSphere Application Server 的端口沖突問題提供一種解決思路。