寫在前面
申明一下,關於系列五的前4篇的介紹都是基於 draw2d 的版本version 2.3.0 上的開發。
截至目前(2013/05), draw2d的最新版本已經是version 2.6.1 了。
對於tooltip 的功能,在 version 2.3.0是沒有提供,但是, 在version 2.6.1已經提供了實現tooltip的方式。
實現tooltip in version 2.6.1
在沒有看到實現源代碼之前,以為實現方式應該是在draw2d.js 給 shape 加上一個tooltip 的屬性,提供一些set 或hide 的方法 供調用。
實際看過之後才發現並非這樣。先直接貼上如何實現的Source Code:
MyFigure = draw2d.shape.basic.Rectangle.extend({

    NAME : "MyFigure",

    init : function()
    {
        this._super();

        this.createPort("input");
        this.createPort("output");
        this.setDimension(50,50);

        this.tooltip = null;
    },

    /**
     * @method
     * Change the color and the internal value of the figure.
     * Post the new value to related input ports.
     *
     */
    onMouseEnter: function(){
        this.showTooltip();
    },

    onMouseLeave: function(){
        this.hideTooltip();
    },

    setPosition: function(x,y){
        this._super(x,y);
        this.positionTooltip();
    },

    hideTooltip:function(){
        this.tooltip.remove();
        this.tooltip = null;
    },


    showTooltip:function(){
        this.tooltip= $('<center class="tooltip">Tooltip</center>').appendTo('body');
        this.positionTooltip();
    },

    positionTooltip: function(){
        if( this.tooltip===null){
            return;
        }

        var width =  this.tooltip.outerWidth(true);
        var tPosX = this.getAbsoluteX()+this.getWidth()/2-width/2+8;
        var tPosY = this.getAbsoluteY()+this.getHeight() + 20;
        this.tooltip.css({'top': tPosY, 'left': tPosX});
    }

});
可以發現, 實現方式其實是疊加式的, 並沒有在原有的定義處進行修改, 而是提供給開發者擴展的這種方式。
繼承一個shape類--》mouse enter 和 mouse leave 時打開和關閉tooltip. tooltip 的實現就是在body 頁面添加一個center, 設置此center的css 樣式及position.
既然是這種實現方式,則在老版本上應該依據此種方式也可以添加tooltip 了。
試了一下, 沒有成功。 原因是 onMouseEnter 和 onMouseLeave 的事件觸發方法沒有執行。 看來要達成此效果,需要修改draw2d.js 使 shape 的mouse enter 和mouse leave的事件方法可以執行。 另外就是要加入tooltip 的 CSS了。
老版本的其他解決方案
如果使用的是draw2d 的老版本,是否有其他方式實現tooltip 的功能呢?
答案肯定是有的。
實現原理和新版本的實現應該是類似的。
介紹解決方案之前先介紹一下jQueyUI
jQuery UI - jQuery user interface , 是使用jQuery 實現的一些界面元素。
在jQueryUI 1.9 版本及以上就有tooltip 的組件。(1.8 版本及以下都沒有)
看一下如何實現:
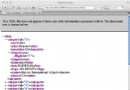
<!-- by oscar999 -->
<!DOCTYPE html PUBLIC "-//W3C//DTD HTML 4.01 Transitional//EN" "http://www.w3.org/TR/html4/loose.dtd">
<html>
<head>
<meta http-equiv="Content-Type" content="text/html; charset=UTF-8">
<title>Tooltip Test</title>

<script src="../js/jquery-1.9.1.js"></script>
<script src="../js/jquery-ui-1.10.3.custom.js"></script>

<link rel="stylesheet" href="../css/ui-lightness/jquery-ui-1.10.3.custom.css">

<script>
$(window).load(function(){
    $("#center1").tooltip();
});
</script>
</head>
<body>
<center id="center1" title="This jQueryUI tooltip!">Mouse over me!</center>
</body>
</html>
實現方式是: 查找頁面元素是否有title 的屬性, 如果有的話, 就添加 tooltip 的center.
所以如果我們給頁面的svg的figure 添加title 的屬性應該就可以顯示美觀的tootip 了。
如果要給Rectangle 這種shape 添加 tooltip
具體需要修改:
1. draw2d.shape.basic.Rectangle 的repaint 定義部分
新增以下部分 (定義在repaint 而不是init 的原因是 在repaint 中有使用到attributes)
attributes.title = stitle;
2. draw2d.shape.basic.Rectangle 的createShapeElement 定義部分.(此部分通過raphael 創建shape)
createShapeElement: function () {
    return this.canvas.paper.rect(this.getAbsoluteX(), this.getAbsoluteY(), this.getWidth(), this.getHeight(), null, this.getTitle());
}
3. raphael 創建shape 的部分添加title 屬性
//add title
paperproto.rect = function (x, y, w, h, r ,t) {
    var out = R._engine.rect(this, x || 0, y || 0, w || 0, h || 0, r || 0, t || "");
    this.__set__ && this.__set__.push(out);
    return out;
};
//add title
R._engine.rect = function (svg, x, y, w, h, r, t) {
    var el = $("rect");
    svg.canvas && svg.canvas.appendChild(el);
    var res = new Element(el, svg);
    res.attrs = {x: x, y: y, width: w, height: h, r: r || 0, rx: r || 0, ry: r || 0, fill: "none", stroke: "#000", title: t || ""};
    res.type = "rect";
    $(el, res.attrs);
    return res;
};