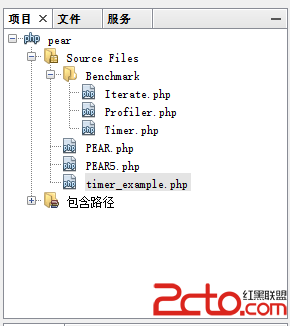
本文章來給大家介紹PHPstorm中xdebug安裝配置說明,這也不是我頭一次配置PHPstorm,下面把經驗分享給各位。
配xdebug已經不是第一次了,但配phpstorm的xdebug還是頭一次(自認糾錯能力還是挺強的,再加上對框架的熟悉程度很能快,知道問題文件所在位置直接修復代碼,就沒必要去用xdebug+IDE調試找問題了)。從4月份參加新工作以來一直沒時間折騰IDE層面上的東西,今天終於有點空余的時間可以自由發揮下了~
由於安裝和配置xdebug是老生常談的話題,這裡就不再敘述安裝xdebug的方式和過程,僅針對phpstorm要求的php.ini講解下xdebug部分的配置要求。
php.ini配置
"[xdebug]
zend_extension=”/usr/lib/php/extensions/no-debug-non-zts-20090626/xdebug.so”
xdebug.idekey=”PHPSTORM”
xdebug.remote_host=127.0.0.1
xdebug.remote_enable=on
xdebug.remote_port = 9000
xdebug.remote_handler = “dbgp”
xdebug.auto_trace = 1
xdebug.collect_includes = 1
xdebug.collect_params = 1
xdebug.collect_return = 1
xdebug.default_enable = 1
xdebug.collect_assignments = 1
xdebug.collect_vars = 1
xdebug.remote_autostart = 1
xdebug.remote_connect_back = 1
xdebug.show_local_vars = 1
xdebug.show_exception_trace = 0
"關於 xdebug.so 如何配置,Xdebug 文檔中有說明:
"Configure PHP to Use Xdebug
add the following line to php.ini: zend_extension=”/wherever/you/put/it/xdebug.so” (for non-threaded use of PHP, for example the CLI, CGI or Apache 1.3 module) or: zend_extension_ts=”/wherever/you/put/it/xdebug.so” (for threaded usage of PHP, for example the Apache 2 work MPM or the the ISAPI module). Note: In case you compiled PHP yourself and used –enable-debug you would have to use zend_extension_debug=. From PHP 5.3 onwards, you always need to use the zend_extension PHP.ini setting name, and not zend_extension_ts, nor zend_extension_debug. However, your compile options (ZTS/normal build; debug/non-debug) still need to match with what PHP is using.
Restart your webserver.
Write a PHP page that calls ‘phpinfo()’ Load it in a browser and look for the info on the Xdebug module. If you see it next to the Zend logo, you have been successful! You can also use ‘php -m’ if you have a command line version of PHP, it lists all loaded modules. Xdebug should appear twice there (once under ‘PHP Modules’ and once under ‘Zend Modules’).
"其中使用 zend_extension_ts 還是 zend_extension 還是神馬神馬,與 PHP 版本有關,仔細看上面的說明。
重啟下 Web Server(Apache / Nginx),使用 phpinfo() 頁面或命令行工具,確認模塊安裝完成。
phpstorm配置
我用的是phpstorm5.0.4,即便是更低版本也沒關系,本教程所講述的配置方式在4.0~5.+版本中是通用的。
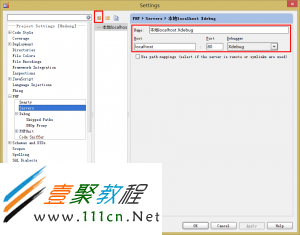
1.File>Settings,PHP | Server:點擊+符號,Name一欄輸入你給服務器指定的名稱,Host一欄輸入調試服務器的地址,無需“http://”開頭。Port一欄輸入服務器的商品(通常為默認值80),Debugger一欄選擇Xebug。
Debugger一欄選擇Xebug。
2.File>Settings,PHP | Debug,在Xdebug標簽框內,根據服務器端的Xdebug端口,配置Debug port,並根據需要配置其它參數。
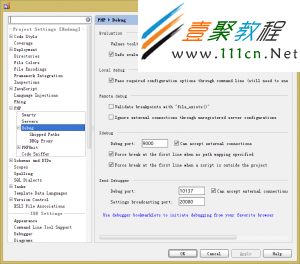
3.點擊 Use debugger bookmarklets to initiate debugging from your favorite browser,在系統的默認浏覽器中配置debugger書簽。
4.默認浏覽器被打開,並進入http://www.jetbrains.com/phpstorm/marklets/,修改Xebug一欄下的Ide key,默認為PHPSTORM。
5.點擊Xdebug一欄中的Generate按鈕,在浏覽器的書簽中添加Xdebug組,其中有Xdebugger的各個項。
6.回到PHPStorm,在settings對話框中的 PHP | Debug | Xdebug Proxy中,將第五步中指定的Ide key添入,並配置代理主機及代理端口。
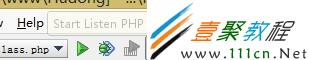
到此,已經可以使用“監聽”功能了。 只 要在訪問指定的調試服務器上的應用程序時,先在PHPStorm中點擊 Start Listen PHP Debug connection按鈕,啟動對調試端口的監聽;
點擊浏覽器書簽中的xdebug Start Session,開啟debug功能,再點擊xdebug this page、xdebug break on、xdebug break off等,即可調用PHP Storm,對程序進行調試,增刪斷點、顯示當前狀態下變量和表達式的值,非常的方便。
另外針對框架/項目的調試方式需要在以上配置基礎上,再進行一些配置:
1.點擊菜單裡的 Run – Edit Configurations選項。
2.在彈出的對話框中,依圖配置:
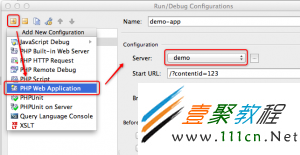
3.如圖所示:點擊 “添加” 按鈕,選擇 PHP Web Application,並在右側輸入配置名稱,選擇我們剛剛添加的 Server,Start URL 中填寫調試可能所需的查詢字符串,選擇好默認浏覽器,最後點擊 Apply 和 OK,確認配置。
4.然後,還有一步:
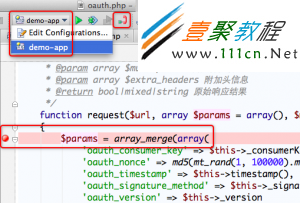
在程序中設置好斷點;
在工具欄中,選擇好要調試的應用;
點擊 Start Listen PHP Debug Connections 按鈕,即那個紅色的電話按鈕,讓其變成綠色,即開始監聽 PHP Debug 連接;
於是,終於可以開始了。
點擊上圖中的 Debug 按鈕,或者從菜單中選擇 Run – Debug,你就開始了 Debug 之旅…
根據斷點配置,或在打開 Debug URL 的過程中,或在 POST 之後,如果 PhpStorm 監聽到了 Debug 連接,就會立即切換到編輯器界面,並跳轉到設置的斷點處,浏覽器端會等待 PhpStorm 的操作。
你可以隨時中斷 PhpStorm 的調試,或方便的進行 Step Into / Step Over / Run to cursor(這個刁爆了):
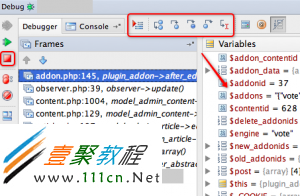
熟悉 Java 的童鞋會對這個界面感到親切,吼吼。
哎呀,不想調試了,PhpStorm 卻總是跳出來?記得剛剛那個電話按鈕嘛,再點一下,讓其變成紅色,就好了。
先到這裡,嗯哼。自己搗鼓搗鼓吧