在優化php代碼執行效率過程中,有個好辦法是利用xdebug生成profile文件,然後查看整個程序的瓶頸在哪裡。現在xdebug profile的查看程序有好幾個,在這裡羅列一下.
Wincachegrind
Wincachegrind是windows下的profile查看程序,使用起來感覺還不錯,profile文件太大的話偶爾會崩潰。
今天在高春輝的博客上看到這些:
最近又開始拿 Xdebug 和 wincachegrind 對項目的 PHP 代碼進行分析和優化,但是發現和自己輸出的執行時間總是相差十倍,差的不是零頭,而是十倍。
上網搜索了一下,原來在 Xdebug 2.0.0RC4 版本開始,對 profiler 日志中的時間單位進行了修改。
(“Use µ seconds instead of a tenths of µ seconds to avoid confusion in profile information. ”)
而 wincachegrind 又不再升級維護了,所以凡是用 2.0.0RC4 以及之後版本的 Xdebug 輸出的 profiler 日志用 wincachegrind 來分析的話,都會有十倍的時間差距。
他已經提供了hack後的版本,可以解決時間差距的問題,有興趣的同學可以試試。
CachegrindVisualizer
CachegrindVisualizer是一個xdebug的profile文件查看客戶端,采用Adobe的AIR制作。
更詳細的介紹可以看以前寫的關於CachegrindVisualizer的介紹。
Kcachegrind
Kcachegrind是linux下的一個圖形化profile查看工具,功能很強勁。
Callgrind uses runtime instrumentation via the Valgrind framework for its cache simulation and call-graph generation. This way, even shared libraries and dynamically opened plugins can be profiled. The data files generated by Callgrind can be loaded into KCachegrind for browsing the performance results.
webgrind
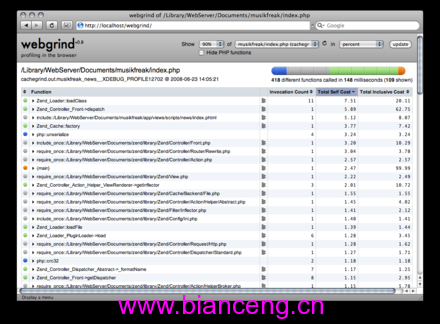
webgrind和wincachegrind的功能差不多,但是webgrind是基於web的,采用php寫的查看工具。看了一下代碼,跑在linux的服務器比較好。
Webgrind is an Xdebug profiling web frontend in PHP5. It implements only a minimal subset of the features of kcachegrind, but installs in seconds and works on all platforms. For quick’n'dirty optimizations it does the job.
下面是用webgrind查看phpmyadmin的profile抓圖: