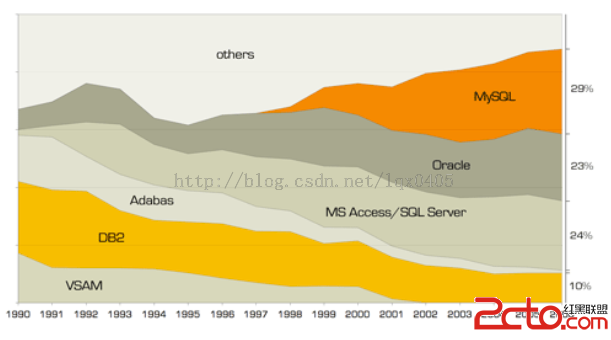
從AWR中的TOP 5等待來看:
<span style="font-size:12px;">Top 5 Timed Events                                         Avg %Total
~~~~~~~~~~~~~~~~~~                                        wait   Call
Event                                 Waits    Time (s)   (ms)   Time Wait Class
------------------------------ ------------ ----------- ------ ------ ----------
latch: cache buffers lru chain      774,812     140,185    181   29.7      Other
gc buffer busy                    1,356,786      61,708     45   13.1    Cluster
latch: object queue header ope      903,456      55,089     61   11.7      Other
latch: cache buffers chains         360,522      49,016    136   10.4 Concurrenc
gc current grant busy               112,970      19,893    176    4.2    Cluster
          -------------------------------------------------------------  </span>
可以看到,TOP 5中,有3個是latch相關的等待,而另外2個則是跟RAC相關的等待。
<span style="font-size:12px;">                                                                  Avg
                                            %Time  Total Wait    wait     Waits
Event                                 Waits -outs    Time (s)    (ms)      /txn
---------------------------- -------------- ----- ----------- ------- ---------
latch: cache buffers lru cha        774,812   N/A     140,185     181       1.9
gc buffer busy                    1,356,786     6      61,708      45       3.3
latch: object queue header o        903,456   N/A      55,089      61       2.2
latch: cache buffers chains         360,522   N/A      49,016     136       0.9
gc current grant busy               112,970    25      19,893     176       0.3
gcs drm freeze in enter serv         38,442    97      18,537     482       0.1
gc cr block 2-way                 1,626,280     0      15,742      10       3.9
gc remaster                           6,741    89      12,397    1839       0.0
row cache lock                       52,143     6       9,834     189       0.1  </span>
從上面的數據還可以看到,除了TOP 5等待,還有”gcs drm freeze in enter server mode“以及”gc remaster”這2種比較少見的等待事件,從其名稱來看,明顯與DRM有關。那麼這2種等待事件與TOP 5的事件有沒有什麼關聯?。MOS文檔”Bug 6960699 – “latch: cache buffers chains” contention/ORA-481/kjfcdrmrfg: SYNC TIMEOUT/ OERI[kjbldrmrpst:!master] [ID 6960699.8]”提及,DRM的確可能會引起大量的”latch: cache buffers chains”、”latch: object queue header operation”等待,雖然文檔沒有提及,但不排除會引起”latch: cache buffers lru chain“這樣的等待。<span style="font-size:12px;">_gc_affinity_time=0 _gc_undo_affinity=FALSE </span>不幸的是,這2個參數是靜態參數,也就是說必須要重啟實例才能生效。
<span style="font-size:12px;">_gc_affinity_limit=250
_gc_affinity_minimum=10485760  </span>

甚至可以將以上2個參數值設置得更大。這2個參數是立即生效的,在所有的節點上設置這2個參數之後,系統不再進行DRM,經常一段時間的觀察,本文描述的性能問題也不再出現。
下面是關閉DRM之後的等待事件數據:
<span style="font-size:12px;">Top 5 Timed Events                                         Avg %Total
~~~~~~~~~~~~~~~~~~                                        wait   Call
Event                                 Waits    Time (s)   (ms)   Time Wait Class
------------------------------ ------------ ----------- ------ ------ ----------
CPU time                                         15,684          67.5
db file sequential read           1,138,905       5,212      5   22.4   User I/O
gc cr block 2-way                   780,224         285      0    1.2    Cluster
log file sync                       246,580         246      1    1.1     Commit
SQL*Net more data from client       296,657         236      1    1.0    Network
          -------------------------------------------------------------

                                                                  Avg
                                            %Time  Total Wait    wait     Waits
Event                                 Waits -outs    Time (s)    (ms)      /txn
---------------------------- -------------- ----- ----------- ------- ---------
db file sequential read           1,138,905   N/A       5,212       5       3.8
gc cr block 2-way                   780,224   N/A         285       0       2.6
log file sync                       246,580     0         246       1       0.8
SQL*Net more data from clien        296,657   N/A         236       1       1.0
SQL*Net message from dblink          98,833   N/A         218       2       0.3
gc current block 2-way              593,133   N/A         218       0       2.0
gc cr grant 2-way                   530,507   N/A         154       0       1.8
db file scattered read               54,446   N/A         151       3       0.2
kst: async disk IO                    6,502   N/A         107      16       0.0
gc cr multi block request           601,927   N/A         105       0       2.0
SQL*Net more data to client       1,336,225   N/A          91       0       4.5
log file parallel write             306,331   N/A          83       0       1.0
gc current block busy                 6,298   N/A          72      11       0.0
Backup: sbtwrite2                     4,076   N/A          63      16       0.0
gc buffer busy                       17,677     1          54       3       0.1
gc current grant busy                75,075   N/A          54       1       0.3
direct path read                     49,246   N/A          38       1       0.2  </span>
自己理解:DRM(Dynamic Resource Management)理論上實現了對非master的節點提升為master節點,可以減少跨節點資源訪問,但是卻帶來了更多的問題。假如一個rac集群中有兩個節點,節點2在空閒時段cache了一張很大很大的表,到了業務繁忙時段,節點1需要訪問該表,如果沒有DRM,則會從存儲中訪問,但是如果有了DRM,就會在節點2中找到該cache資源,從節點2的cache中將該資源傳到節點1,這樣的話就會消耗大量的帶寬,從而消耗了很多資源。