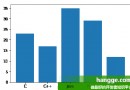
圖像直方圖,In essence, it is to count the values of all pixel points of the image,The number of pixels in different sub-intervals on the horizontal axis is taken as the value on the vertical axis.
一、利用Matplotlib繪制圖像直方圖
在Matplotlib模塊中,有一個pyplot.hist函數,You can count the frequency of occurrence of array values in different intervals,That is, the histogram is calculated.
語法格式如下,參考官方API文檔:
matplotlib.pyplot.hist(x, bins=None, range=None, density=False, weights=None, cumulative=False, bottom=None, histtype='bar', align='mid', orientation='vertical', rwidth=None, log=False, color=None, label=None, stacked=False, *, data=None, **kwargs)
Because there are many parameters involved,Let's focus on it.
- xIs a one-dimensional array or a sequence of multiple one-dimensional arrays;可以是二維數組,But it cannot be an array of more than two dimensions.
- binsis the horizontal axis division parameter;如果bins是一個整數,Represents the number of divisions on the horizontal axis,默認取10;如果binsis a sequence of numbers,Each numerical value in the series represents the horizontal axis separation point.
- rangeis the effective display range of the horizontal axis(計數范圍),Only data within this range is displayed.
- densityis the probability density histogram flag,默認為False,Indicates that the value of the vertical axis is the number of numerical points in the subinterval;如果設置為True,Indicates that the area enclosed by the histogram and the horizontal axis should be 1,Therefore, the counts for each subinterval need to be normalized.
- The function returns a one-dimensional array or a sequence of one-dimensional arrays(取決於x的類型),因為bins默認是10,So the default length of each one-dimensional array is 10;The value of each element of the one-dimensional array represents the number of times in the corresponding subinterval.
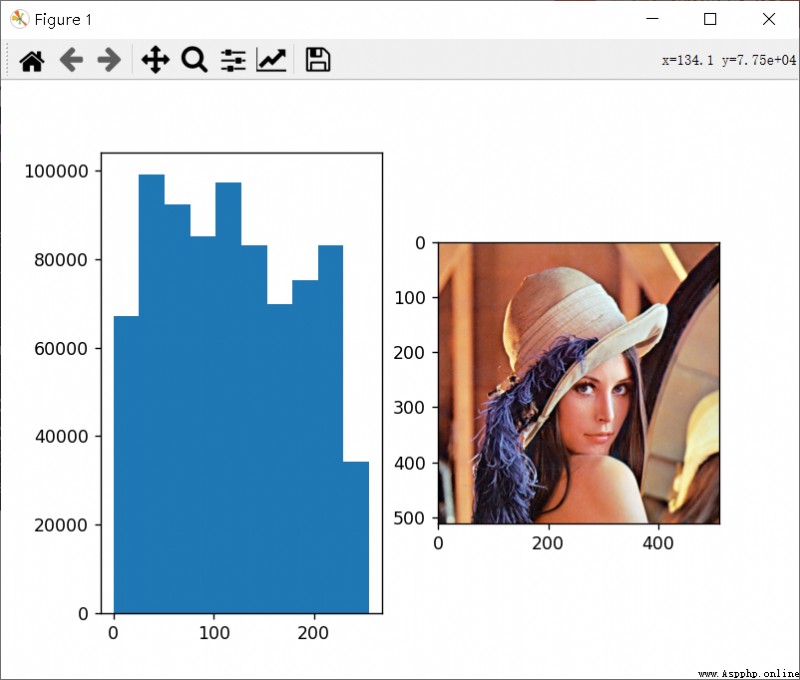
Share a case below.
import cv2 as cv
import matplotlib.pyplot as plt
img = cv.imread('images/lena.png')
plt.figure()
plt.subplot(1,2,1)
arr = plt.hist(img.ravel())
plt.subplot(1,2,2)
plt.imshow(img[:, :, ::-1])
plt.show()
print(img.ravel())
print(arr)
cv.waitKey()
cv.destroyAllWindows()
二、 利用OpenCV中的calcHist繪制
OpenCV中的calcHistThe function can only be used to calculate the numerical information corresponding to the image histogram,而無法像matplotlib.pyplot的histThe function can also draw the histogram directly after execution.
OpenCV中的calcHist函數的語法格式如下.
cv.calcHist(images, channels, mask, histSize, ranges[, hist[, accumulate]])
- imagesShould be bit depth8Bit unsigned integer OR32Image multidimensional array of bit floats;In writing, square brackets should be placed around the image multidimensional array variable,比如[img].
- channelsis the channel index number,Indexes are enclosed in square brackets;對於灰度圖,只能用[0];對於BGRA three-channel image multidimensional array,可以用[0]、[1]、[2],Indicates that the blue color is calculated separately、綠色、Histogram on the red channel.Only one channel can be used for calculations at a time,This is different from the first part of this article,第一部分用的plt.histThe function allows parallel computation of multi-channel histograms on color images,However, such a calculation method will definitely reduce the accuracy of the histogram feature.
- maskis the mask control parameter,如果傳入None,Mask control is not performed,The calculation is performed directly on the full graph;And if you need to calculate a specific sub-region of the image,Then you can build a mask layer before running the function.
- histSize代表了bin的數目,It also needs to be enclosed in square brackets;比如對於uint8圖像,histSize=[255]All pixel values are individually counted.
- rangesis the count range,Only pixel values within the count range will be counted;一般來說是[0, 255].
- hist是一個histSize*1的數組,Each element represents the correspondingbinThe number of pixels in the range(Obviously an integer).
計算得到hist後,If you want to draw a line-type histogram,可以用plt.plot(hist)——Formatting such as color and linetype is not involved,Just wanted to mention briefly here,Give the reader an idea.
三、利用numpy中的histogram函數繪制
numpy中的histogram函數與OpenCV中的calcHist函數一樣,Neither can directly draw a histogram,All can only get eachbinPixel count within.
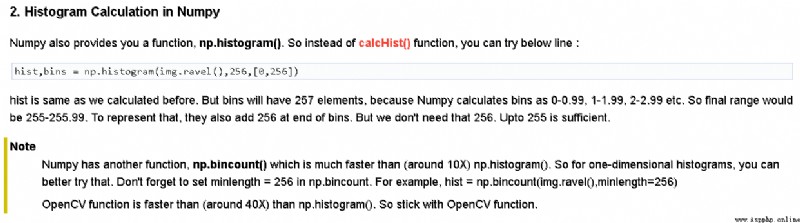
但是!!!OpenCV中的calcHist函數以及matplotlib的hist函數的binsThe division method is left closed and right open,Only the rightmost interval is fully closed,比如[0, 1),[1, 0),...,[244, 255];而numpy中的histogram函數是xxx(The picture below is taken from the official website——OpenCV: Histograms - 1 : Find, Plot, Analyze !!!)
剛開始我以為numpyThis function is indeed as described on the official website,But then I found out that I don't need it at allbins=256,將range=[0, 256] .詳見下面的代碼,Although the last point is10,在第10個binPixels are still included10,說明最後一個bin的區間范圍是[9, 10],而不是[9, 9.99].
import numpy as np
print(np.histogram([[1, 2, 5, 10], [1, 0, 3, 10]], bins=10, range=[0, 10]))
# (array([1, 2, 1, 1, 0, 1, 0, 0, 0, 2], dtype=int64), array([ 0., 1., 2., 3., 4., 5., 6., 7., 8., 9., 10.]))
說明!!!numpy的histogram函數的binsThe allocation mechanism is the same as the other two.
下面是numpy的histogram函數的語法格式,源於numpy.histogram — NumPy v1.23 Manual
numpy.histogram(a, bins=10, range=None, normed=None, weights=None, density=None)
- a是n維數組,Note that it is not followed herematplotlib.pyplot.hist函數和cv.calcHist函數一樣,It has no limit on the dimension of the array;Because before computing the histogram features,會對aPave directly.
- bins是直方圖xAxion interval delimitation parameters;跟matplotlib.pyplot.histfunction is almost the same.
- rangeis the count range,Only pixel values within the count range will be counted;一般來說是[0, 255].
- normed參數已經在numpy 1.6.0被遺棄,不再建議使用.
- weights是一個與a形狀相同的n維數組;aEach value in contributes only its associated weight to bin計數(而不是1;It means that if the corresponding weight is 2,Then this pixel is locatedbinCount plus is2而不是1).如果density為True,Then normalize the weights,so that the sum of the densities over that range remains as 1.
- density參數跟matplotlib.pyplot.histThe meaning of the function is the same.