# This import registers the 3D projection, but is otherwise unused.
from mpl_toolkits.mplot3d import Axes3D # noqa: F401 unused import
import matplotlib.pyplot as plt
import numpy as np
# Fixing random state for reproducibility
np.random.seed(19680801)
def randrange(n, vmin, vmax):
'''
Helper function to make an array of random numbers having shape (n, )
with each number distributed Uniform(vmin, vmax).
'''
return (vmax - vmin)*np.random.rand(n) + vmin
fig = plt.figure()
ax = fig.add_subplot(111, projection='3d')
n = 100
# For each set of style and range settings, plot n random points in the box
# defined by x in [23, 32], y in [0, 100], z in [zlow, zhigh].
for m, zlow, zhigh in [('o', -50, -25), ('^', -30, -5)]:
xs = randrange(n, 23, 32)
ys = randrange(n, 0, 100)
zs = randrange(n, zlow, zhigh)
ax.scatter(xs, ys, zs, marker=m)
ax.set_xlabel('X Label')
ax.set_ylabel('Y Label')
ax.set_zlabel('Z Label')
plt.show()
輸出: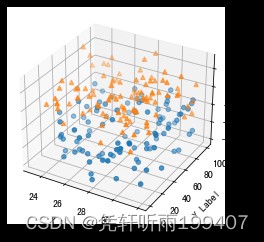
這個輸入的三個維度要求是三列長度一致的數據,可以理解為3個length相等的list。
用上面的scatter或者下面這段直接plot也可以。
fig = plt.figure()
ax = fig.gca(projection='3d')
ax.plot(h, z, t, '.', alpha=0.5)
plt.show()
輸出: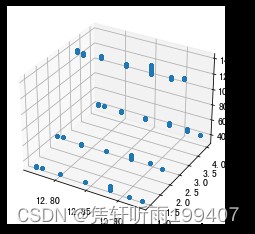
x = [12.7, 12.8, 12.9]
y = [1, 2, 3, 4]
temp = pd.DataFrame([[7,7,9,9],[2,3,4,5],[1,6,8,7]]).T
X,Y = np.meshgrid(x,y) # 形成網格化的數據
temp = np.array(temp)
fig = plt.figure(figsize=(16, 16))
ax = fig.gca(projection='3d')
ax.plot_surface(Y,X,temp,rcount=1, cmap=cm.plasma, linewidth=1, antialiased=False,alpha=0.5) #cm.plasma
ax.set_xlabel('zone', color='b', fontsize=20)
ax.set_ylabel('h2o', color='g', fontsize=20)
ax.set_zlabel('Temperature', color='r', fontsize=20)
output: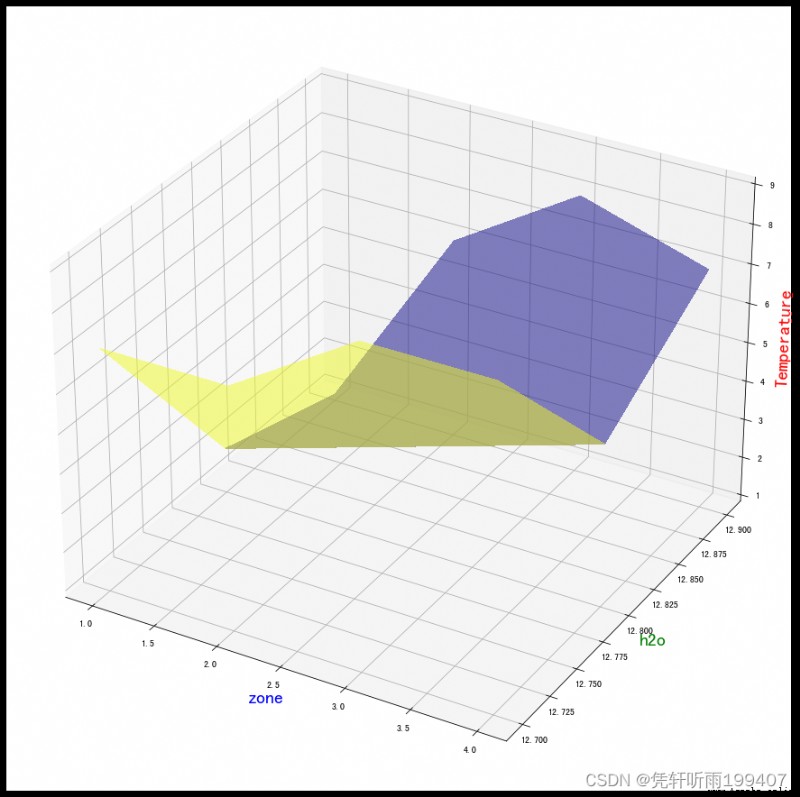
這裡x和y原本都是一維list,通過np.meshgrid可以將其形成4X3的二維數據,如下圖所示: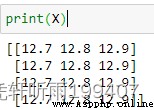
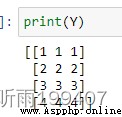
而第三維,得是4X3的2維的數據,才能進行畫圖
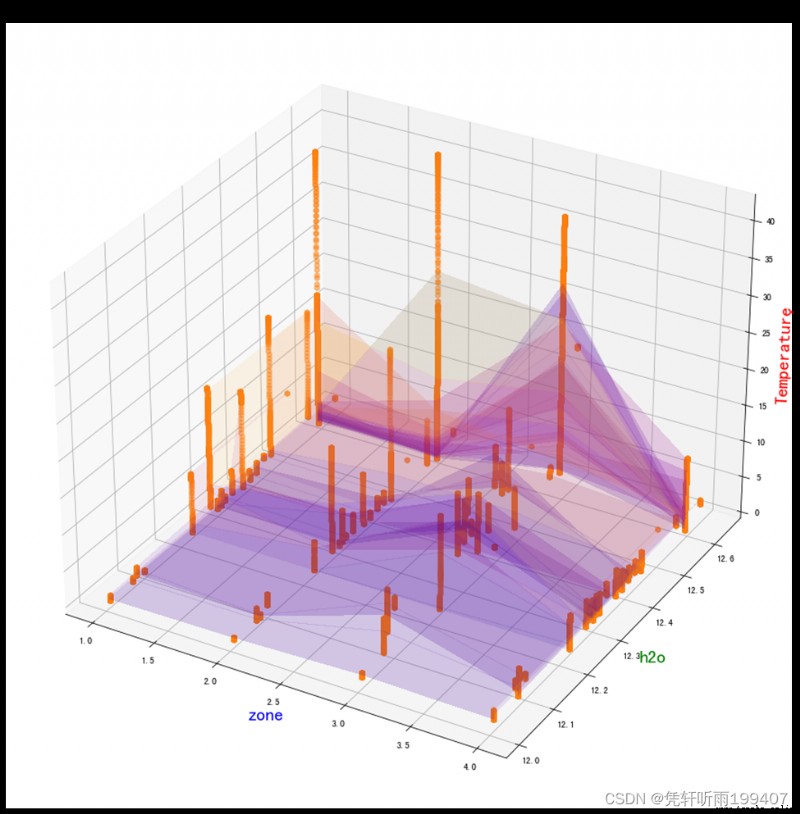
from matplotlib.collections import PolyCollection
import matplotlib.pyplot as plt
from matplotlib import colors as mcolors
import numpy as np
axes=plt.axes(projection="3d")
def colors(arg):
return mcolors.to_rgba(arg, alpha=0.6)
verts = []
z1 = [1, 2, 3, 4]
x1 = np.arange(0, 10, 0.4)
for z in z1:
y1 = np.random.rand(len(x1))
y1[0], y1[-1] = 0, 0
verts.append(list(zip(x1, y1)))
# print(verts)
poly = PolyCollection(verts, facecolors=[colors('r'), colors('g'), colors('b'),
colors('y')])
poly.set_alpha(0.7)
axes.add_collection3d(poly, zs=z1, zdir='y')
axes.set_xlabel('X')
axes.set_xlim3d(0, 10)
axes.set_ylabel('Y')
axes.set_ylim3d(-1, 4)
axes.set_zlabel('Z')
axes.set_zlim3d(0, 1)
axes.set_title("3D Waterfall plot")
plt.show()
輸出: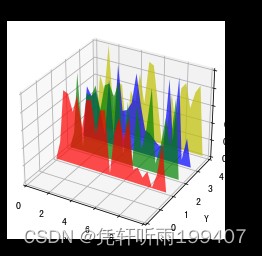
這個的輸入我還沒有完全搞懂,導致我自己暫時不能復現到其他數據,等以後懂了再回來補充。
from mpl_toolkits.mplot3d import axes3d
import matplotlib.pyplot as plt
fig, (ax1, ax2) = plt.subplots(
2, 1, figsize=(8, 12), subplot_kw={'projection': '3d'})
# Get the test data
X, Y, Z = axes3d.get_test_data(0.05)
# Give the first plot only wireframes of the type y = c
ax1.plot_wireframe(X, Y, Z, rstride=10, cstride=0)
ax1.set_title("Column (x) stride set to 0")
# Give the second plot only wireframes of the type x = c
ax2.plot_wireframe(X, Y, Z, rstride=0, cstride=10)
ax2.set_title("Row (y) stride set to 0")
plt.tight_layout()
plt.show()
output: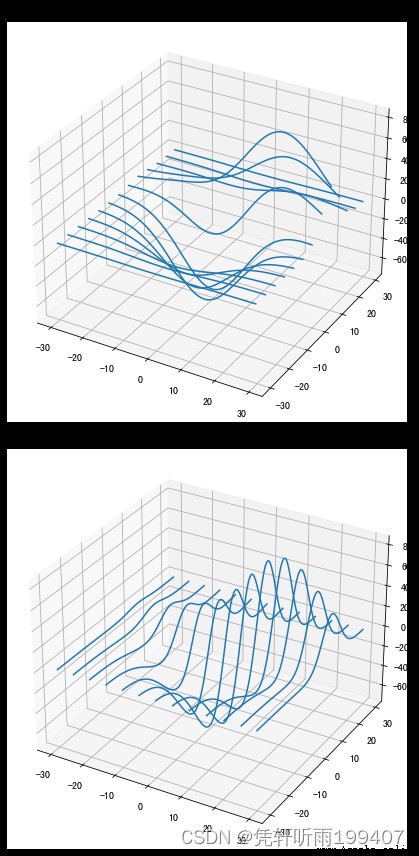
與plot_surface的輸入格式一樣,X,Y原本為一維list,通過np.meshgrid形成網格化數據。Z為二維數據。其中注意調節rstride、cstride這兩個值實現行列間隔的調整。
自己試了下: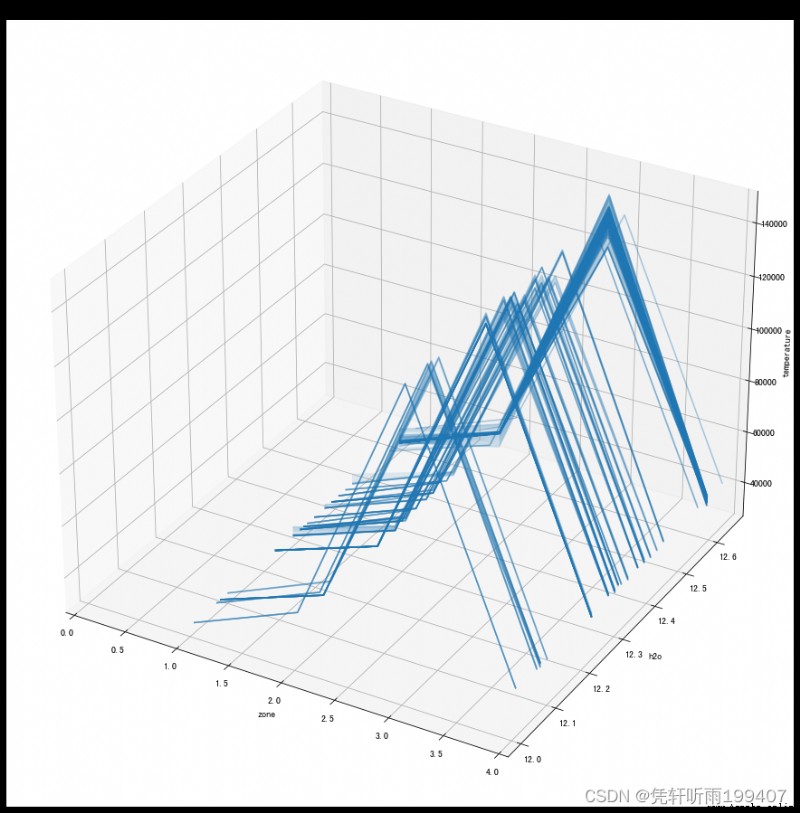
https://matplotlib.org/stable/gallery/mplot3d/hist3d.html
先自我介紹一下,小編13年上師交大畢業,曾經在小公司待過,去過華為OPPO等大廠,18年進入阿裡,直到現在。深知大多數初中級java工程師,想要升技能,往往是需要自己摸索成長或是報班學習,但對於培訓機構動則近萬元的學費,著實壓力不小。自己不成體系的自學效率很低又漫長,而且容易碰到天花板技術停止不前。因此我收集了一份《java開發全套學習資料》送給大家,初衷也很簡單,就是希望幫助到想自學又不知道該從何學起的朋友,同時減輕大家的負擔。添加下方名片,即可獲取全套學習資料哦