聲明:本文為學習筆記,侵權刪
K-Meansis unsupervised learning聚類算法,將一組數據分為K類(或者叫簇/cluster),Each cluster has a centroid(centroid),Homogeneous data are sorted around centroids.The data is divided into several categories and there are several centroids.
1、First randomly selected from the original data setK個數據,作為K個質心.
2、Assign the remaining data to the cluster with the most similar centroid.
3、After the completion of the first category,Calculate the mean of the samples within each cluster,and generate new centroids based on this mean
4、重復2,3步,until the centroid changes by less than a certain value(subjective setting),If the centroid never stabilizes,Can also set a maximum number of iterations,Jumps out of the loop even though the centroid is still unstable.
How to judge the similarity between data?
K-MeansThe criterion for the algorithm to judge the similarity between data is歐氏距離(It can be simply understood as the point-to-point distance formula learned in middle school).Each data can be regarded as a point,A data can be composed of multiple dimensions(For example, whether you can take the postgraduate entrance examination and go ashore can be determined by:智商、努力、luck decides,智商、努力、Luck can be quantified,So it can be imaginedXaxis is IQ,Yaxis is effort,Zaxis is luck,In this way, whether the postgraduate entrance examination can be taken ashore can become a point in the three-dimensional coordinates.).OK,Now the data becomes points in the coordinate system,就可以計算歐氏距離了.歐氏距離越小,The more similar the two data points are.
How to calculate the mean of samples within each cluster?
The data on each axis is averaged separately,then generate a new point:XAxis data is averaged,YThe data of the axis is averaged and so on.新點的坐標:(mean(X),mean(Y),mean(Z)...)
How to judge the pros and cons of the result?
這裡主要討論簇內誤差平方和(SSE),簡單來說:SSE=The sum of the distances from all points in a cluster to the centroid.SSE越小,效果通常更好.當然,SSEcannot be used as the sole criterion,因為SSEOnly the correlation of samples within the cluster is considered,Does not take into account the correlation between clusters.同時如果Kvalue set too large,too many clusters,There are few samples in a cluster,那SSEOf course smaller,But that doesn't mean the classification is better.
Repeat the same set of data multiple timesK-Means算法,Is the result the same??
不是,Because the initial centroids are random,So the final results will have certain randomness,但大體上是一樣的.
回憶一下之前做RFM分類中,將用戶分為8大類.RFMA flaw in classification is that:Criteria for classification are subjective,Therefore, it is difficult to be objective and accurate for the classification criteria..而使用K-Meanswill make up for this defect.
The dataset used here is stillRFM的那個.

在使用K-Means的時候,還是選擇R(The time interval since the last consumption),F(消費次數),M(消費總金額)The three sets of data are the most user-classified indicators.
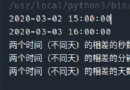
The three sets of data are as follows:
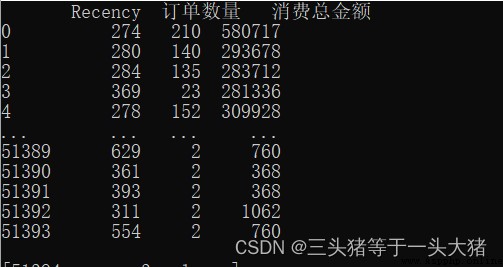
產生一個問題
R,F,Mas a coordinate point,describe a data point,但是在K-MeansTo calculate the distance between data points to judge the similarity of different data points.If the original data is used(如上圖),計算距離的時候,M(消費總金額)Too much effect on distance,resulting in poor model performance(因為M數值很大,When calculating the Euclidean distance between data points,F,Mlittle role in it,這是不理想的.舉個例子:用戶A只消費了1次,and consumption time20天,但金額巨大,有100萬;用戶B消費了100次,and the most recent consumption5天,The total consumption is also very large,共99萬.計算A,Bwhen the similarity,幾乎只有M在起作用,Therefore, it is possible toA,BDivided into a,但很明顯,Aare upstarts,B是回頭客,Obviously not the same kind of person).In order to eliminate a data that is particularly large/Very small but impact model,我們需要對數據標准化處理(Normalization).
數據標准化:Restrict a large range of data to a specific interval.The most common normalization method used in this example is to limit the values to the mean.0,方差為1的正態分布中:
.好處有很多,就不一一贅述了.
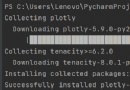
#normalization
from sklearn.preprocessing import StandardScaler
scaler = StandardScaler()
x_normalization = scaler.fit_transform(x)
x_df = pd.DataFrame(x_normalization,columns=x.columns,index=x.index)
print(x_normalization)
print(x_df)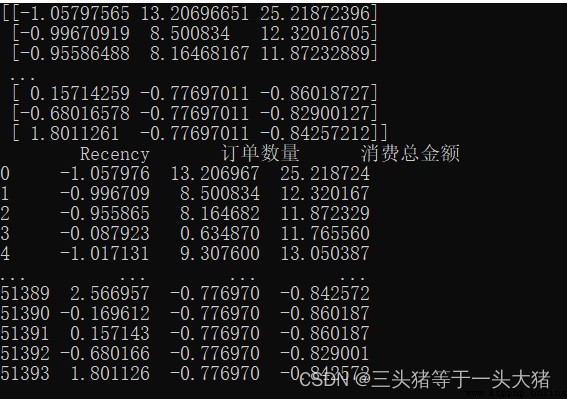
很明顯,通過數據標准化,The numerical difference between the small lot,Therefore, the model can also be trained better.
do it beforeRFMModel expectations,將用戶分為8類:
from sklearn.cluster import KMeans
KMeans_model = KMeans(n_clusters=8,random_state = 1)
KMeans_model.fit(x_normalization)
#質心
print(KMeans_model.cluster_centers_)
#每個樣本的標簽
print(KMeans_model.labels_)
#SSE
print(KMeans_model.inertia_) 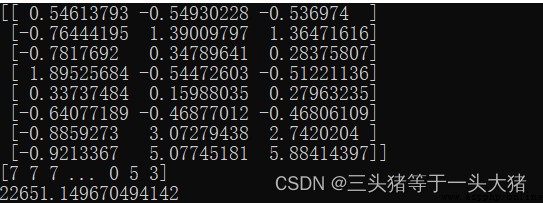
二維數組表示8the coordinates of the centroid(R,F,M).
A one-dimensional array indicating which class each sample is classified into
最後的22651表示SSE
從RFM的角度來說,The classification is successful.但又有一個問題:
really need to divide8類嗎?Is it too finely divided??
so asked,Of course it does not need to be divided into8類的,但為什麼呢?因為:在做K-Means的時候,需要遵從肘部法則.
肘部法則
肘部法則:在K-Means算法的時候,取不同的K值,計算出對應的SSE,繪制折線圖,會出現一個K值K_,當K<K_時,SSE下降幅度很大,K≥K_時,SSEThe decline has been flattened.
意義:SSEwhen a big drop,Description of the addition of each class to the loweringSSEhave significant effect,也就是說,This new class is necessary.反之,Shows the new class don't have much.
We can draw in this example,Kwhen taking different valuesSSE的變化情況:
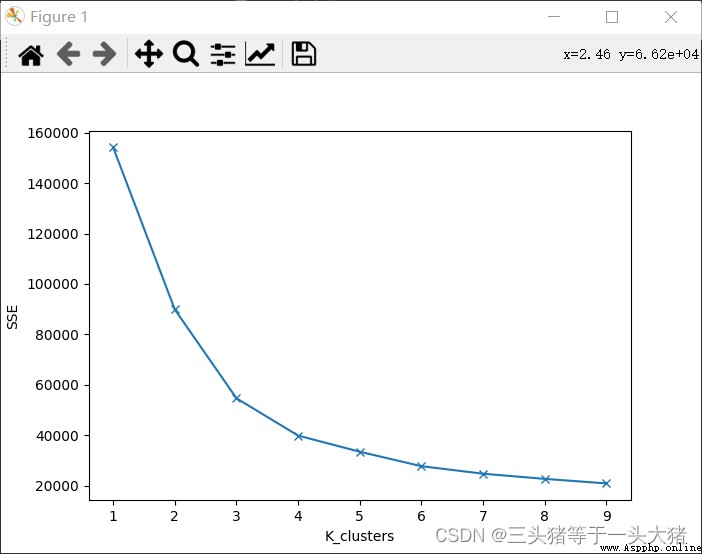
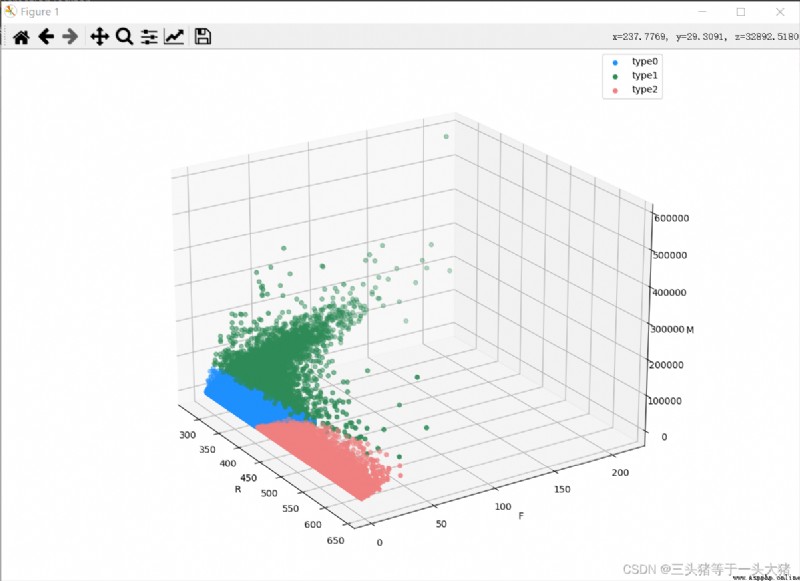
從上圖中可以看到,K≥4的時候(分成4class and above),SSEThe decline is no longer obvious,而K<3的時候SSE下降明顯,因此選用K=3訓練模型,and draw the corresponding3D散點圖.
import matplotlib.pyplot as plt
from mpl_toolkits.mplot3d import Axes3D
labels = KMeans_model.labels_
fig = plt.figure()
ax = Axes3D(fig)
color = ["dodgerblue", "seagreen", "lightcoral"]
for i in range(3):
#The class that gets assigned is the classi的所有數據
d = x[labels == i]
ax.scatter(d["Recency"], d["訂單數量"], d["消費總金額"], color=color[i], label=f"type{i}")
ax.set_xlabel("R")
ax.set_ylabel("F")
ax.set_zlabel("M")
# 使用plt.legend()Function display legend
plt.legend()
# 展示圖像
plt.show()