Because of Baidu or Gaode API Only domestic POI, Google API Need to climb over the wall and charge , So I have been wondering why I whore abroad for nothing POI Data headache . Recently, I finally found a way , Use OSMnx, To be based on OSM The map provides POI data .
In the process of learning , I found that no one actually wrote a related article introduction , There is no way but to touch the stone to cross the river , Learn little by little , This function is most proposed in github issue Mentioned in . For the initial function design 、 Content presentation and other issues are discussed , It's still interesting . At the same time, I also thank these open source contributors , Thank you very much !
OSMnx It is from the planning department of Nanjing University Geoff Boeing Written by professor OpenStreetMap Of python Expansion pack .
Refer to the official website :https://geoffboeing.com/
OSMnx Basic functions of : Download street network 、 download POI、 Download the urban road network structure 、 Visualization, etc. .
There are many basic tutorials online , But I recommend the introduction written by the author in the following link
https://geoffboeing.com/2016/11/osmnx-python-street-networks/
For this article , We just need to know , How to obtain the administrative location boundary can , Because get POI To use .
Get the administrative location boundary :osmnx.geocode_to_gdf(place)
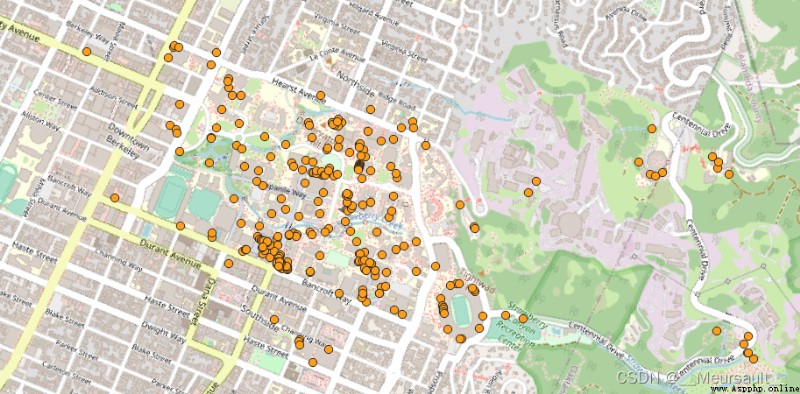
This paper takes (‘Berkeley, California’) As place
import osmnx as ox
place = 'Berkeley, California'
city = ox.geocode_to_gdf(place)
ax = ox.project_gdf(city).plot()
_ = ax.axis('off') # Eliminate the chart box

OSMnx Provide access to POI Methods , And originally in github issue The names in are different , The current module is called osmnx.geometries module. The modules are very regular , given 5 A way to get data , Namely :
osmnx.geometries_from_address(address, tags, dist=1000)
geometries.geometries_from_bbox(north, south, east, west, tags)
osmnx.geometries.geometries_from_place(query, tags, which_result=None, buffer_dist=None)
osmnx.geometries.geometries_from_point(center_point, tags, dist=1000)
osmnx.geometries.geometries_from_polygon(polygon, tags)
this 5 Methods , You can choose according to your needs . The specific content can be seen Official documents , The following main uses 4 and 5 Method .
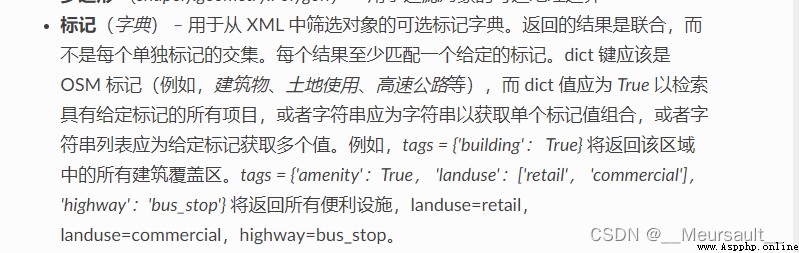
Need to be right tags emphasize . What you want to get is through tags To define , Please refer to relevant materials for details . Here is only given to get all POI.
tags = {"amenity": True} # Represents all POI
Here, in order to compare different methods , Use 4 and 5 Method for demonstration .
Method 4: The longitude and latitude of a given point and the search range , Get point centric , Point to the data within the range
Method 5: Given city name , Get city wide data
Get longitude -122.3133443 ; dimension 37.9285095, Near this point 10km Of POI Distribution .
# longitude -122.3133443 dimension 37.9285095
p1 = ox.geometries.geometries_from_point((37.9285095, -122.3133443),
tags={'amenity': True},
dist=10000)
Got p1 It's a DataFrame,index Consists of three :node,way,relation.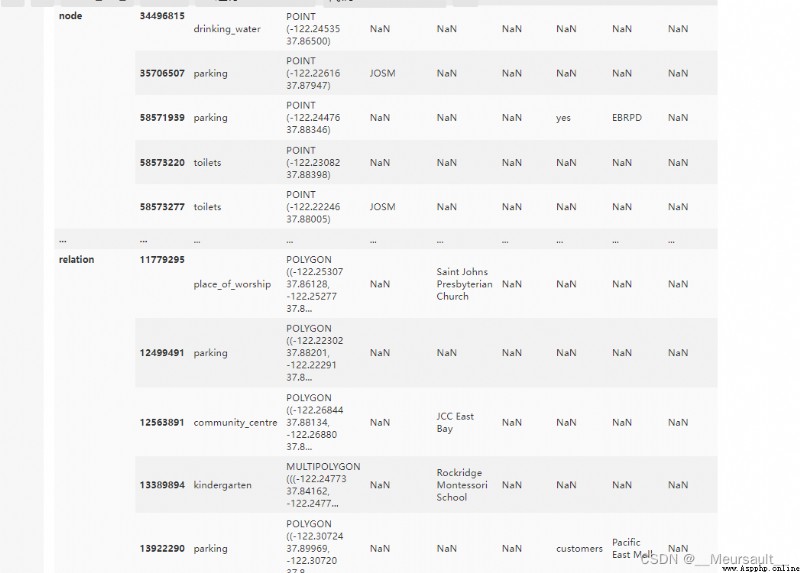
We will p1 Visualize the content of
ds = p1.loc['node']['geometry']
ds2 = p1.loc['way']['geometry']
ds3 = p1.loc['relation']['geometry']
fig = plt.figure(figsize = (15,10))
ax = plt.subplot()
ds.plot(edgecolor = 'b', alpha = 0.5, ax = ax)
ds2.plot(edgecolor = 'k',alpha = 0.5, ax = ax)
ds3.plot(edgecolor = 'r',alpha = 0.5, ax = ax)
plt.show()
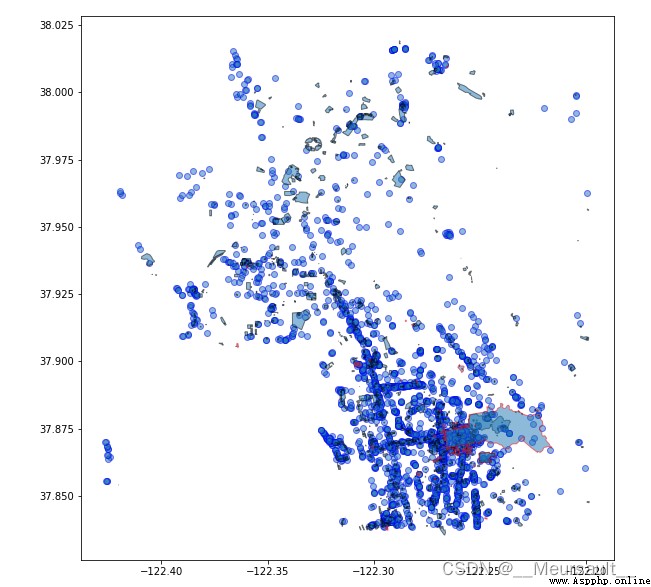
way and relation Is the polygon in the figure , For getting POI It doesn't make much sense , We just need node
ox.geometries_from_polygon(place) , Among them place Need to be shapely.geometry.Polygon or shapely.geometry.MultiPolygon data type , Therefore, it is necessary to obtain the city boundary function mentioned at the beginning geocode_to_gdf, By first obtaining the boundary of the specified city , Then pass the boundary into geometries_from_polygon
place = 'Berkeley, California'
city = ox.geocode_to_gdf(place) # Get city boundaries
p2 = ox.geometries_from_polygon(city['geometry'].all(), tags={"amenity": True} )
Visualization of all contents
ds = p2.loc['node']['geometry']
ds2 = p2.loc['way']['geometry']
ds3 = p2.loc['relation']['geometry']
fig = plt.figure(figsize = (15,10))
ax = plt.subplot()
ds.plot(edgecolor = 'b', alpha = 0.5, ax = ax)
ds2.plot(edgecolor = 'k',alpha = 0.5, ax = ax)
ds3.plot(edgecolor = 'r',alpha = 0.5, ax = ax)
plt.show()
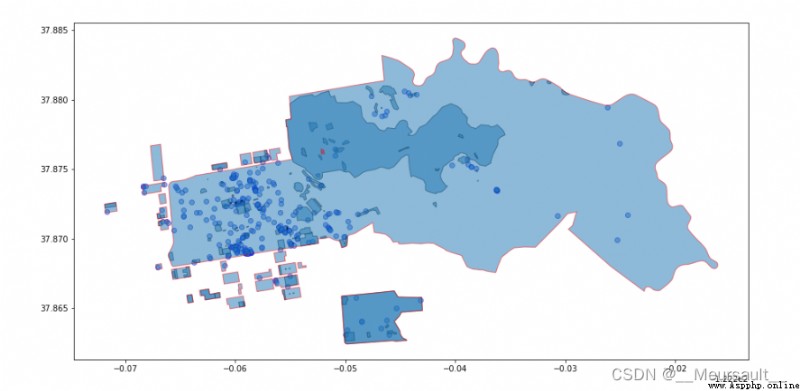
POI visualization 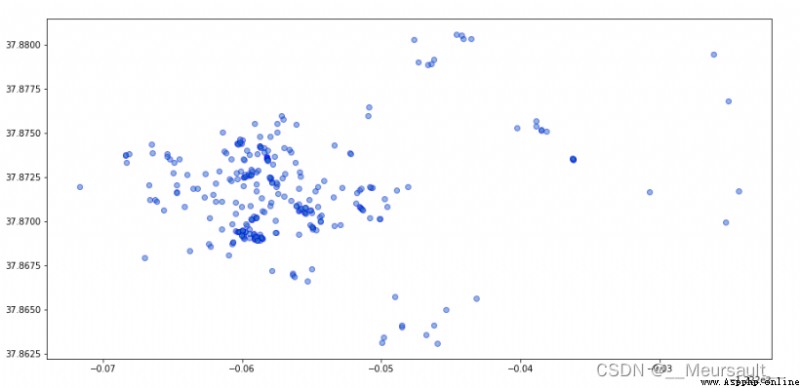
Finally, store data , Can be p1 All content is stored as csv, Convenience is right POI Classify and analyze , Can also be POI Click Save as shp file , Convenient in gis Software operation .
p2.to_csv(r'..\all_poi.csv')
p2.loc['node']['geometry'].to_file(r'..\node.shp')
gis In