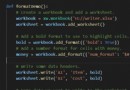
import pandas as pd
from bokeh.charts import output_file, Chord
from bokeh.io import show
from bokeh.sampledata.les_mis import data
nodes = data['nodes']
links = data['links']
nodes_df = pd.DataFrame(nodes)
links_df = pd.DataFrame(links)
source_data = links_df.merge(nodes_df, how='left', left_on='source', right_index=True)
source_data = source_data.merge(nodes_df, how='left', left_on='target', right_index=True)
source_data = source_data[source_data["value"] > 5]
source_data
chord_from_df = Chord(source_data, source="name_x", target="name_y", value="value")
output_file('chord-diagram-bokeh.html', mode="inline")
show(chord_from_df)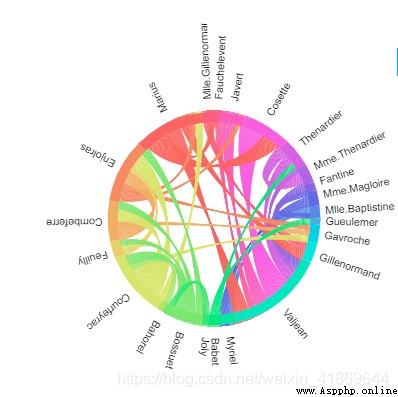
The blogger opened a new official account , I hope you can scan the code and pay attention , Thank you very much .

This article is from :https://github.com/holtzy/The-Python-Graph-Gallery/blob/master/PGG_notebook.py