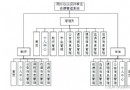
I've long wanted to build a fund monitoring robot , It is convenient for you to check the rise and fall of various indexes of the fund you pay attention to , Stop loss or profit in time , Starting today , Let's build the foundation first , Take you hand in hand to realize a fund query robot , At present, you can mainly query the data of the specified date period of the fund and view the trend chart of the net value of the Fund , Slowly add new functions later .
Linux、Mac、Windows Fine
python 3.7 And above
Relevant third party packages :pandas( Data processing )、requests( Crawl data )、re( Text content analysis )、akshare( Get fund stock data )、matplotlib( Data visualization )、dataframe-image(dataframe Turn tables into pictures )
Fund data can be obtained from some financial related websites , For example, Tiantian Fund Network 、 Sina fund network, etc , You can write your own crawler program to get website data , You can also use an off the shelf toolkit to get the data , such as : One line code to get the stock 、 Fund data , And draw K Line graph Used in akshare.
Here we introduce the following two methods at the same time :
2.2.1 In retrospect akshare Get fund data
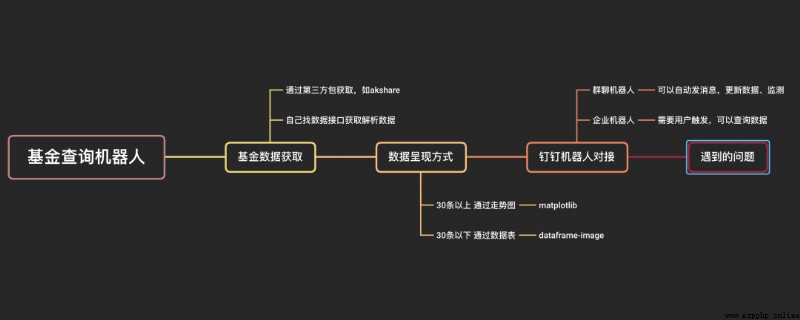
at present akshare It is not supported to obtain the fund net value data within the specified date range , However, the historical net value data of the fund can be obtained at one time , Call function fund_em_open_fund_info Get fund history data , Then I choose the time break according to the date for analysis .
import akshare as ak
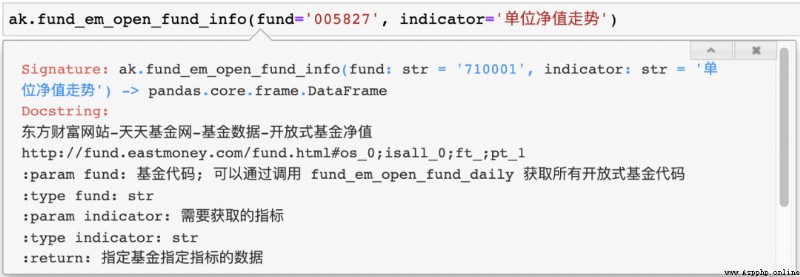
fund_data = ak.fund_em_open_fund_info(fund='005827', indicator=' Unit net worth trend ')
print(fund_data)
Call the ready-made data interface by yourself
Essentially akshare Also get data from some financial related websites , We can also write our own code to get , Through the browser, we can quickly search the fund data interface , Tiantian fund network from Oriental Wealth .
f'http://fund.eastmoney.com/f10/F10DataApi.aspx?type=lsjz&code={code}&page={page}&sdate={start_date}&edate={end_date}&per={per}'
code -  Fund code
page -  Fund data page
start_date -  Data start date
end_date -  Data end date
per -  Amount of data per page , most 40
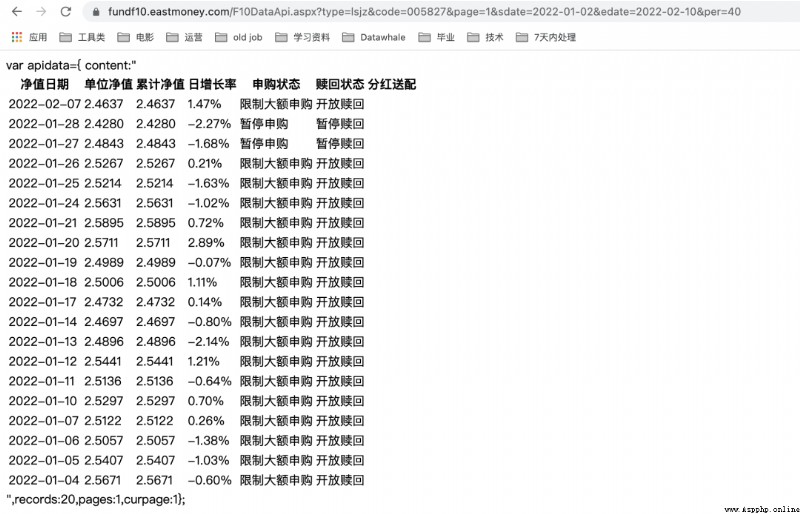
According to the specified parameters , The browser will return the specified parameters , a section js Assignment code , It includes Fund data (content)、 Total number of records (records)、 Total number of pages (pages)、 The current number of pages (curpage).
The format is very regular , We can extract data directly through regularization ,
'''
Get a single page   Fund data
'''
def get_html(code, start_date, end_date, page=1, per=40):
    url = f'http://fund.eastmoney.com/f10/F10DataApi.aspx?type=lsjz&code={code}&page={page}&sdate={start_date}&edate={end_date}&per={per}'
    # print(url)
    rsp = requests.get(url)
    html = rsp.text

    return html
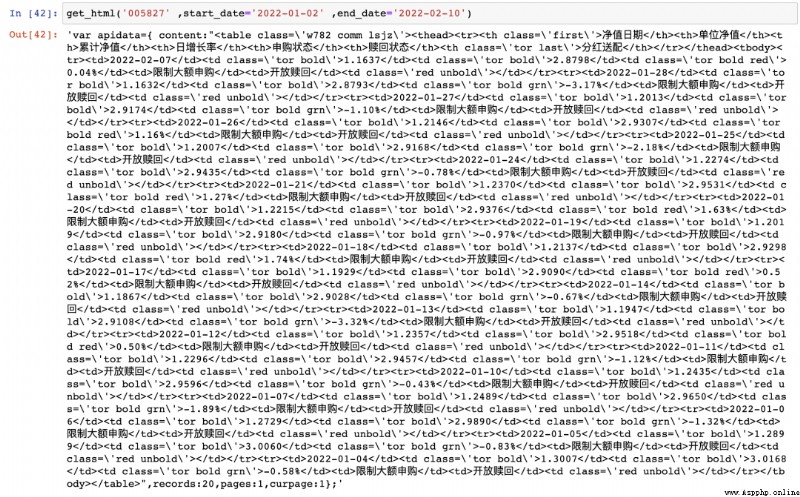
Through the returned data, we can find , The fund data section is made up of table Label wrapped html Code , Then we can use pandas Of read_html To parse the data .
#  from html Parse out the data table part   And resolved into df
def parses_table(html):
    #  Get the fund data sheet
    pattern = 'content:"<table(.*)</table>",'
    table = re.search(pattern, html).group(1)
    table = '<table' + table + '</table>'
    fund_data = pd.read_html(table)[0]
    return fund_data
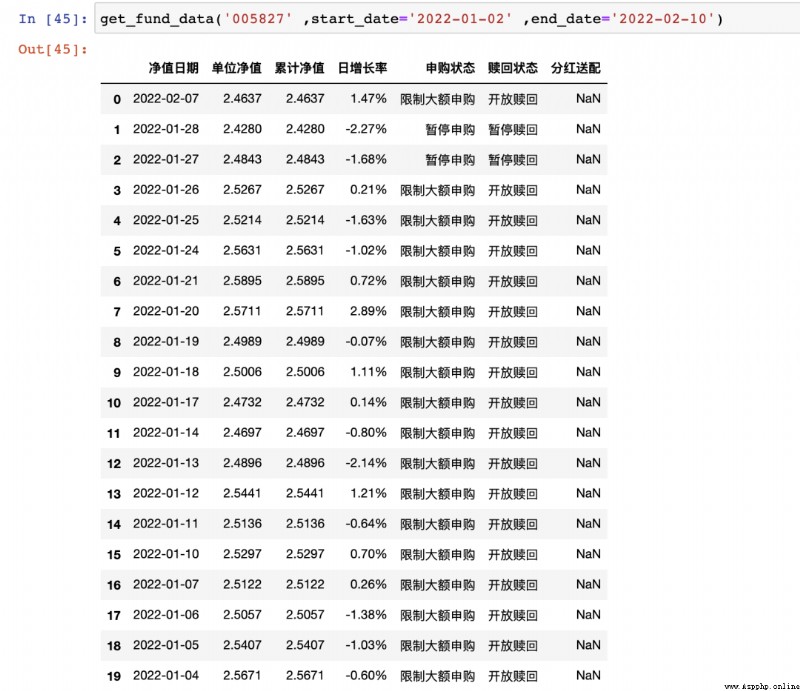
As mentioned earlier , The data returned by the fund data interface can be displayed at most on each page 40 strip , So to get all the data , We may need to traverse every page , Then we also need to adjust the total number of pages by regular pages Get , And then traverse the call get_html and parses_table Function parses all the data .
#  Gets the date within the specified period   Cumulative net worth   Data such as
def get_fund_data(code, start_date, end_date):
    first_page = get_html(code, start_date, end_date)
    #  Get total pages
    pattern = 'pages:(.*),'
    pages = re.search(pattern, first_page).group(1)
    #  Turn into int data
    try:
        pages = int(pages)
    except Exception as e:
        r = f'【 error message 】{e}'
        # print(r)
        return r

    #  Store the fund data obtained on each page  dataframe Format   Easy to merge later
    fund_df_list = []

    #  Circulation facilitates all pages
    for i in range(pages):
        if i == 0:
            fund_data = parses_table(first_page)
        else:
            page_html = get_html(code, start_date, end_date, page=i+1)
            fund_data = parses_table(page_html)
        fund_df_list.append(fund_data)

    #  Merge the data of each page together
    fund_df = pd.concat(fund_df_list)

    return fund_df
The above two methods can obtain the fund net value data , In the end I chose akshare How to get , Set up a scheduled task , Update all the data of the fund you pay attention to at three o'clock every day , Store locally , When you want to query later, you can directly read the local file and query .
Timing task : Every day in the morning 3 Click to get the historical data of all concerned funds , Store locally
#  Timing task : Every day in the morning 3 Click to get the historical data of all concerned funds , Store locally
def get_all():
    try:
        #  Read from file   List of fund codes you are concerned about
        with open('./FD/funds.txt') as f:
            funds = [i.strip() for i in f.readlines()]
        #  Traverse   Update the data one by one
        for fund in funds:
            fund_df = ak.fund_em_open_fund_info(fund, indicator=' Unit net worth trend ')
            fund_df = fund_df.sort_values(by=[' Net value date '], ascending=False)
            fund_df.to_csv(f"./FD/DATA/F{fund}_data.csv", index=False)
            # print(f"./FD/DATA/F{fund}_data.csv")
            time.sleep(random.randint(1,5))
        return ' Fund data update completed '
    except Exception as e:
        r = f"【 error message 】{e}"
        return r
Access to designated funds Specify the date period Net worth data
#  Access to designated funds   Specify the date period   Net worth data
def get_fund_data(fund, start_d, end_d):
    fund_df = pd.read_csv(f'./FD/DATA/{fund}_data.csv')
    result_df = fund_df.query(f"'{start_d}'<= Net value date <='{end_d}'")
    return result_df
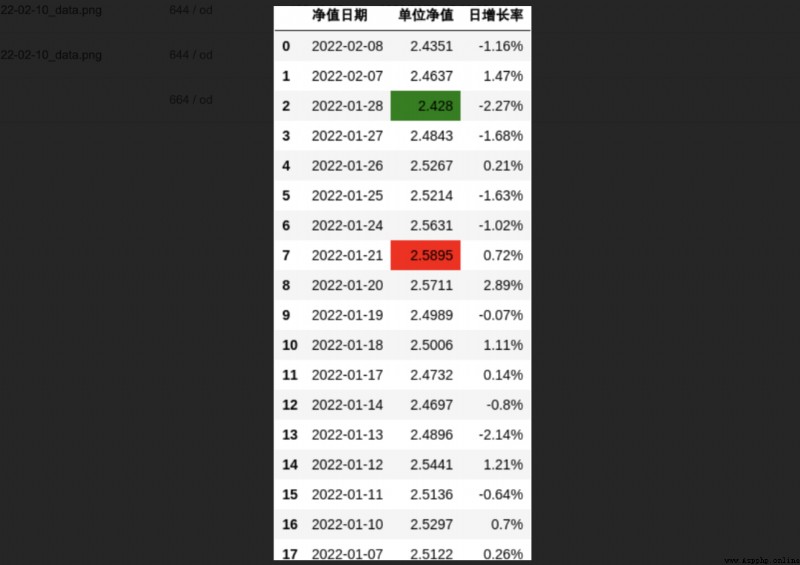
For now, be simple , The rules are as follows :
1) If the amount of data is less than or equal to 30 strip , Return to the original data graph
Raw data graph Is to directly convert the obtained data into pictures and send them to users , Here we use dataframe-image This third party package , Very simple to use ,pip After installation , Call directly export Function to quickly convert datafrmae Data into pictures .
# take dtaframe Turn tables into pictures
def df_to_img(fund_df, fund, start_d, end_d):
if fund_df.shape[0] <=1:
dfi.export(fund_df, f'./FD/IMG/{fund}_{start_d}_{end_d}_data.png')
return
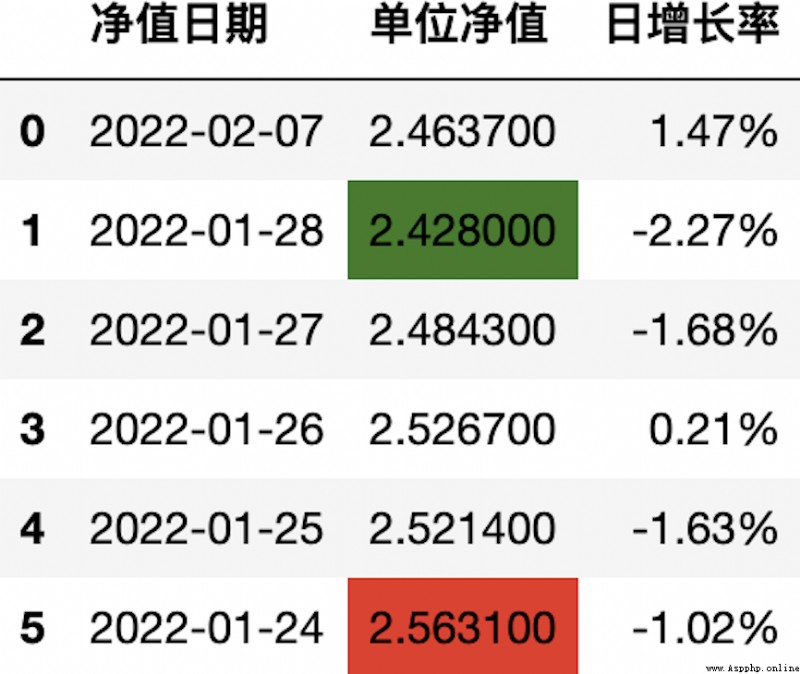
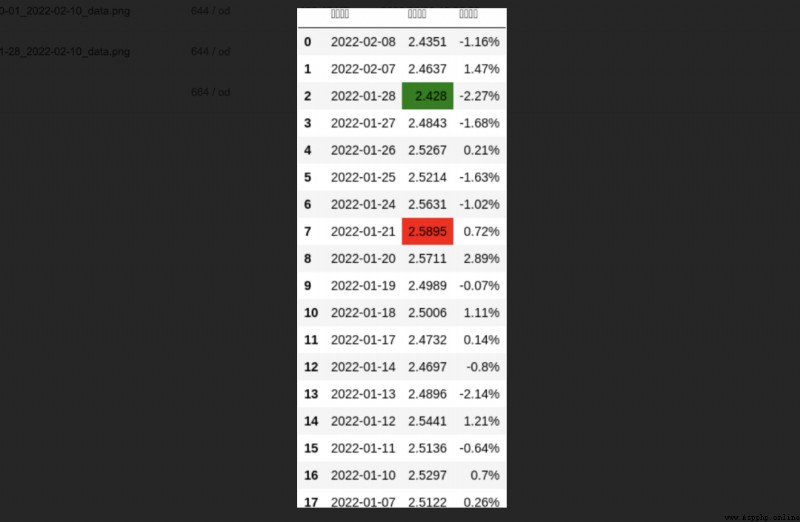
# Format table Highlight the maximum and minimum values
fund_df = fund_df.style.highlight_max(subset=[' Unit net worth '], color='red')\
.highlight_min(subset=[' Unit net worth '], color='green')\
.format({' Daily growth rate ': '{:}%'})
dfi.export(fund_df, f'./FD/IMG/{fund}_{start_d}_{end_d}_data.png')
For better picture data , We also used df.style Set the data table style ( Maximum net worth per unit 、 Highlight the minimum value and add a percentage sign to the daily growth rate ).
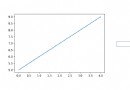
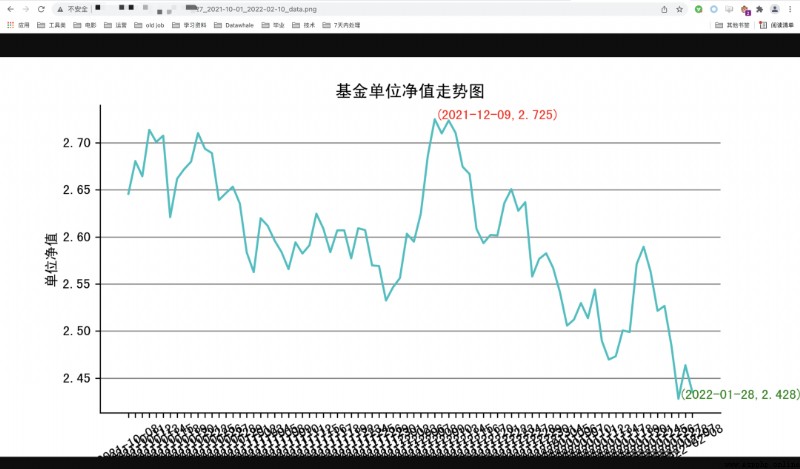
2) If the amount of data is greater than 30 strip , Return to the original data trend chart
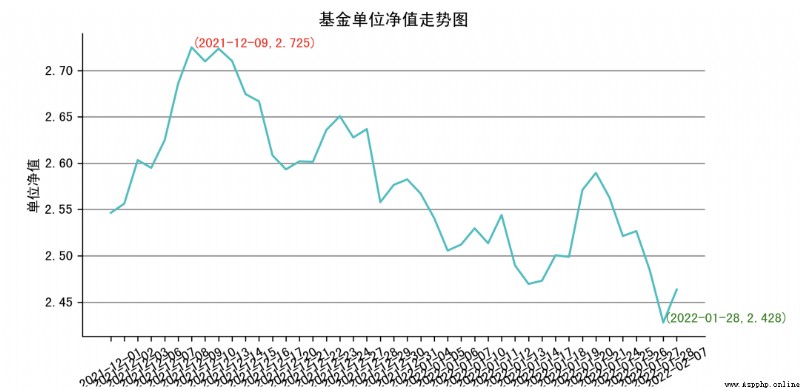
Trend chart of raw data Is to visualize the data , And then back to the user , Here we choose to plot the data ( Trend ) Potential diagram , Use matplotlib Drawing .
#  Draw the trend chart of net value of fund units
def draw_fund_line(fund_df, fund, start_d, end_d):
    plt.rcParams['figure.figsize'] = (8.0, 4.0) #  Set up figure_size Size
    plt.rcParams['savefig.dpi'] = 300 # Save picture resolution
    #  Do not show right 、 On the border
    ax=plt.gca()
    ax.spines['right'].set_color('none')
    ax.spines['top'].set_color('none')
    #  Set the coordinate grid
    plt.grid(axis="y", color='gray')
    #  Calculate the maximum   Minimum coordinates   And mark it in the figure
    fund_max = fund_df.loc[fund_df[' Unit net worth '].idxmax()]
    fund_min = fund_df.loc[fund_df[' Unit net worth '].idxmin()]
    ax.annotate(f'({fund_max[0]},{fund_max[1]})', xy=(fund_max[0], fund_max[1]), color='red')
    ax.annotate(f'({fund_min[0]},{fund_min[1]})', xy=(fund_min[0], fund_min[1]), color='green')
    #  drawing
    plt.plot(fund_df[' Net value date '],fund_df[' Unit net worth '], color="c")
    plt.title(' Trend chart of net value of fund units ')
    plt.xticks(rotation=30)
    plt.xlabel(' Net value date ')
    plt.ylabel(' Unit net worth ')
    plt.savefig(f'./FD/IMG/{fund}_{start_d}_{end_d}_data.png')
The line chart is used here , There are some settings for picture style , such as : size 、 Frame 、 Maximum / Small value labels , But it's still not very beautiful , Continue to optimize later .
Full call
#  Return the data
def response_data(fund, start_d, end_d):
    #  Check locally   Whether the query result already exists
    imgs = os.listdir('./FD/IMG/')
    if f'{fund}_{start_d}_{end_d}_data.png' in imgs:
        return f'./FD/IMG/{fund}_{start_d}_{end_d}_data.png'

    #  get data
    fund_df = get_fund_data(fund, start_d, end_d)

    #  If the amount of data is less than or equal to 30 strip , Return to the original data graph
    if fund_df.shape[0]<= 30:
        df_to_img(fund_df, fund, start_d, end_d)
    else:
        #  Otherwise, the data trend chart will be returned
        fund_df = fund_df.sort_values(by=[' Net value date '])
        draw_fund_line(fund_df, fund, start_d, end_d)
    return f'./FD/IMG/{fund}_{start_d}_{end_d}_data.png'
Nail group robots are mainly used to automatically report the fund data update every day , Later, you can also add fund rise and fall detection, etc .
Enterprise robots are mainly used for fund data query and automatic reply function , You can also take the initiative to send messages to users , Later research .
2.5.1 Linux On datafrmae-image Error converting picture
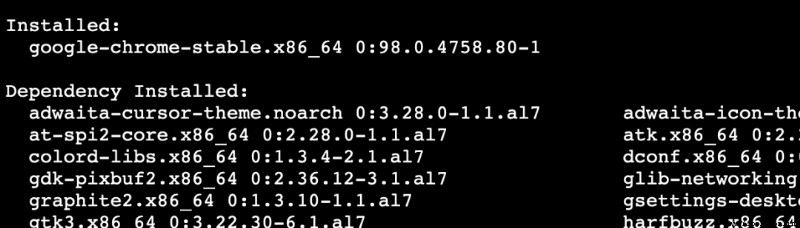
At first, there was no hint chrom, Then follow the online tutorial to install google chrom.
Reference resources :https://segmentfault.com/a/1190000022425145
After installation , Run code prompt SyntaxError: not a PNG file.
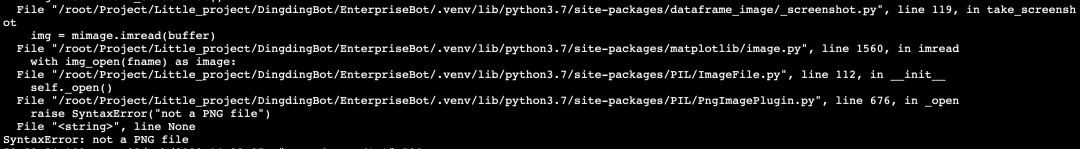
Look at the error prompt and think it is Pillow and matplotlib The problem of , It is not possible to change to the same version as the local version .
Finally, I looked at the source code , It is found that the method can be converted except using chrom, You can also use matplotlib, After modification , You can generate pictures normally , But there is no format !!!

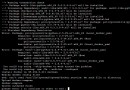
Finally, change back to the default table_conversion, If you look carefully, , The following contents are prompted , What do you mean linux You can't use it directly root User rights allow Google chrome, The easiest way is to create an ordinary user .
[0209/162730.350381:ERROR:zygote_host_impl_linux.cc(90)] Running as root without --no-sandbox is not supported. See https://crbug.com/638180
stay root Under authority , Create a new user od, And will /root Directory permissions are granted to it , Then input su Command to switch to the new user .
useradd od
chown -R od /root
su od
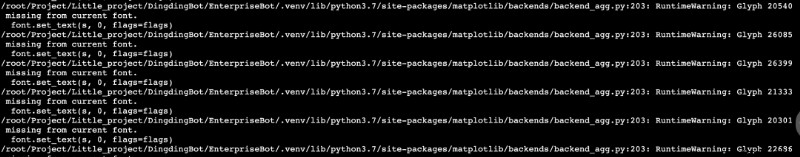
Running again can really solve the problem of image generation and data format , But there are new problems : Header Chinese cannot be displayed ...
All kinds of search , Look at the source code debugging 、 The problem of the project warehouse has not been solved , Last , Finally, it suddenly occurred to me , I can , The versions of the two packages are the same again , It shouldn't be a code problem , Could it be because linux Chinese fonts are not installed in , Therefore, Chinese cannot be displayed ?
root Under the authority of user , Create a directory first , Store Chinese fonts , Create good after , You can directly use the pagoda to transfer the local SimHei Upload the font to the corresponding directory .
mkdir -p /usr/share/fonts/my_fonts
You can check whether the Chinese font is successfully installed through the following instructions ,
fc-list :lang=zh

Run the code again , The generated image is normal ~ Happy !
2.5.2 matplotlib Picture Chinese display problem
I have written a detailed solution before , You can view the previous articles directly : Permanent solution matplotlib Chinese garbled
2.5.3 Nail robot can't transmit pictures directly
Currently, the nail robot only supports transmission : Plain text 、markdown Text 、 Connect 、actionCard News and feedCard Message type .
If I want to send the generated fund data graph to the user , The best way is the same as before , First turn the picture into a link , And then through markdown Form transfer .
If the system is for personal use only , Not a lot of data , We don't have to choose the existing map bed tools on the network ( In this way, we have to write interface docking code ), You can open one directly http Port to share our pictures , The enterprise robot itself has been used flask, So we can implement this function more simply .
app = Flask(__name__, static_folder='xxx/FD/IMG', static_url_path='/static')
Initializing flask app when , Specify the directory where the static file is located and the static file routing suffix , such , We can go through :http:// The server IP Address : Port number /static/ Image file name , Access to the corresponding picture .
Then embed the picture link into markdown in , You can return to the user normally .
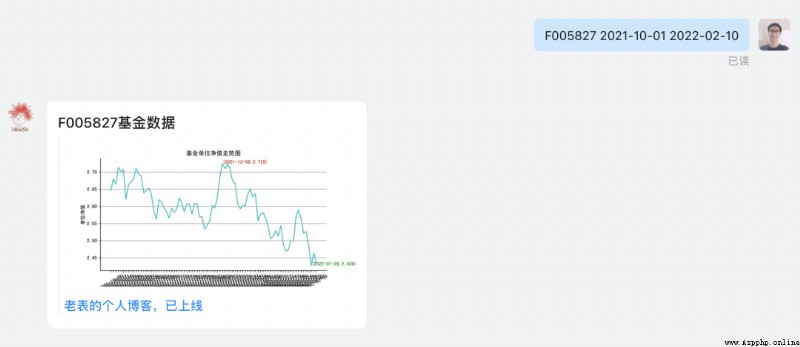
Specify query
View the fund net value data of a fund in a certain period of time .(30 Less than data , The table shows ; Greater than 30 strip , The trend chart shows )
Query format : F Fund code Start date End date , Such as :F005827 2021-12-03 2022-02-10
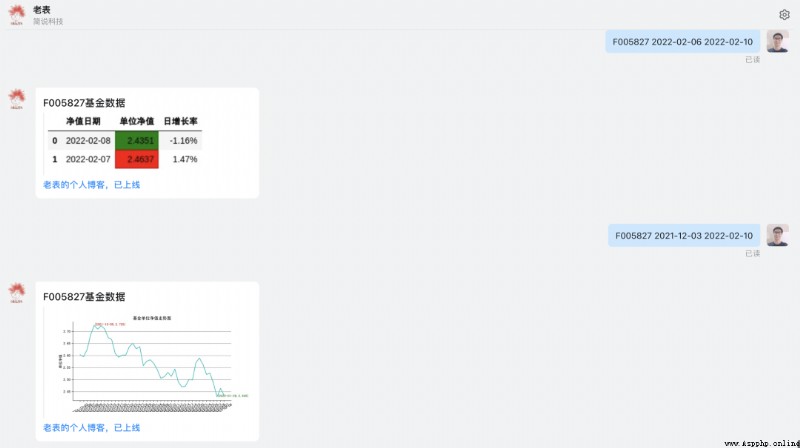
design sketch
Common query
Check the recent of a fund 10 Intraday net worth and daily growth rate data + Trend chart
Query format : F Fund code , Such as :F005827
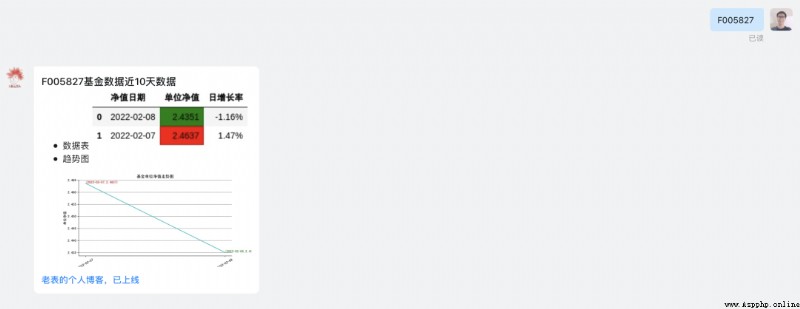
lately 10 Days. , Only two trading days
How big is the project , Small is not small , Hundred lines of code , The local test is still very smooth , Mainly to migrate to Linux There are some problems after the , From the very beginning python Version of the problem ( Installed a 3.7.9), To datafrmae-image problem , Extended Linux Install Google 、 Set up new users 、 Assign permissions , And source code testing . Attention official account requiring complete project source code :Python Source code Can get