The full text pictures and code are transferred from :https://amphenol-sensors.cn/newsinfo/3017644.html
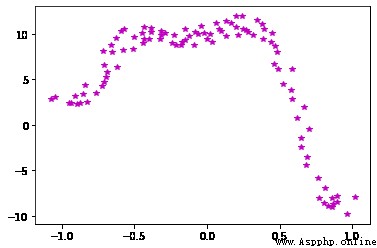
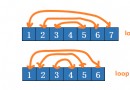
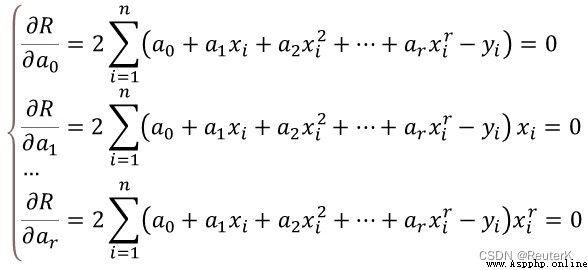
chart -1 Schematic diagram of analog input and output acquisition signal
The full text content can be inquired on the original website . But the feature of this code is to create classes , And the fitting order can be input arbitrarily ( If there is any result, let's say otherwise , Look at the actual input data ). The following is further simplified , After all, code and description are the most important .

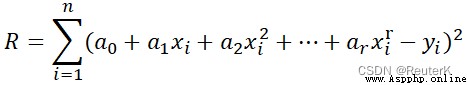
The result equation of output curve fitting (9 Order fitting )
Function(x)=9.798298367046073+4.227514414846013x+17.260341567511098x**2-22.3475762650598x**3-128.91239180578455x**4-46.45306126416519x**5+152.35732377108258x**6+126.51471748420587x**7-53.97163898194201x**8-67.97621051238404x**9
Specify the range and resolution to output the graph after curve fitting ( You can use the default values )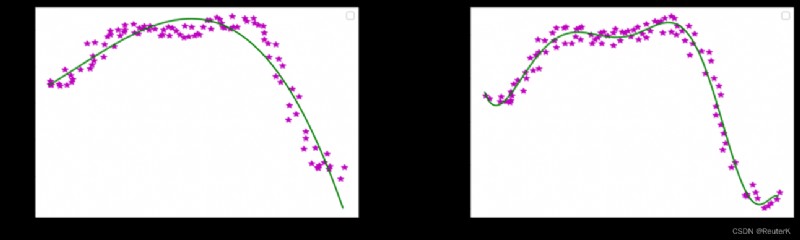
3 Order fitting ( left ) and 9 Order fitting 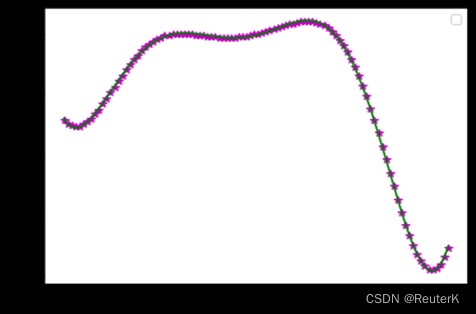
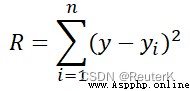
Ideal curve output
import matplotlib.pyplot as plt
import math
import numpy
import random
class LeastSqauresCF():
def __init__(self):
self.order = 1
self.Xvalues = None
self.Yvalues = None
self.fig = plt.figure()
self.subfig = self.fig.add_subplot(111)
#========================================
# Draw the input points/curve in a figure
#========================================
def ReadAnddrawInputPoints(self,Inputx=None,InputY=None, order=1):
try:
if Inputx is None or InputY is None:
return False
if(len(Inputx)!=len(InputY)):
return False
if order <=0:
return False
if type(order) !=int:
self.order = int(order)
else:
self.order = order
self.Xvalues = Inputx
self.Yvalues = InputY
self.subfig.plot(Inputx,InputY,color='m',linestyle='',marker='*')
return True
except Exception as e:
print(e)
return False
#========================================
# Calculate curve fitting factor matrix
#========================================
def produceFittingCurveFactors(self):
try:
#(1) Generate matrix [X]
matX=[]
for i in range(0,len(self.Xvalues)):
matx1=[]
for j in range(0,self.order+1):
dx=1.0
for l in range(0,j):
dx = dx * self.Xvalues[i]
matx1.append(dx)
matX.append(matx1)
#(2) Generate matrix [X]T.[X]
matX_Trans = numpy.matrix(matX).T
matX_FinalX = numpy.dot(numpy.matrix(matX_Trans),numpy.matrix(matX))
#(3) Generate matrix Y' =[X]T.[Y]
matFinalY = numpy.dot(matX_Trans,numpy.matrix(self.Yvalues).T)
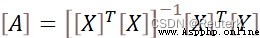
#(4) Solve the function:[A] = [[X]T.[X]]**(-1).[X]T.[Y]
matAResult=numpy.linalg.solve(numpy.array(matX_FinalX),numpy.array(matFinalY))
return matAResult
except Exception as e:
print(e)
return None
#========================================
# Output fitting curve function
#========================================
def outputFittingCurveFunction(self, inputMatFactors=None):
if inputMatFactors is None:
return False
i = 0
strFitting="Function(x)="
for a in inputMatFactors:
#print(a[0])
if i==0:
strFitting +=str(a[0])
else:
strFitting +=("+"if a[0]>0 else"") +str(a[0])+(("x**"+str(i)) if i>1 else "x")
i+=1
print(strFitting)
return strFitting
#========================================
# draw the curve based on the result function
#========================================
def drawFittedCurve(self, xRangeMin=None,xRangeMax=None,matAResult=None,resolution=0.01):
try:
if matAResult is None:
return False
if xRangeMin is None or xRangeMax is None:
xRangeMin = self.Xvalues[0]
xRangeMax = self.Xvalues[-1]
#print('xRangeMin: ',xRangeMin, 'xRangeMax: ',xRangeMax)
xxa= numpy.arange(xRangeMin,xRangeMax,resolution)
yya=[]
for i in range(0,len(xxa)):
yy=0.0
for j in range(0,self.order+1):
dy=1.0
#x[i]**j
for k in range(0,j):
dy*=xxa[i]
#a[j]*(x[i]**j)
dy*=matAResult[j]
yy+=dy
yya.append(yy)
#print(xxa,yya)
self.subfig.plot(xxa,yya,color='g',linestyle='-',marker='')
self.subfig.legend()
plt.show()
return True
except Exception as e:
print(e)
return False
#============================
# main
#============================
if __name__=="__main__":
LS = LeastSqauresCF()
#============================
#(1-1) Generate simulation data set
#============================
x = numpy.arange(-1,1,0.02)
y = [(5*a+2)*(3*a*a+1)*numpy.sin(a*2)*numpy.cos(a*4)+5 for a in x]
#============================
#(1-2) Add some noises to input and output data
#============================
x_noised=[]
y_noised=[]
i=0
for yy in y:
xx = x[i]
Ns=float(random.randint(90,110))/100
x_noised.append(xx*Ns)
y_noised.append(yy*Ns+5*Ns)
i+=1
#============================
#(1-3) Sort x, y in case x's sequence was disturbed during adding noise
#============================
zip_x_y = zip(x_noised,y_noised)
sorted_zip = sorted(zip_x_y, key=lambda x:x[0])
sorted_x, sorted_y = zip(*sorted_zip)
#print(sorted_x,sorted_y)
#============================
#(2) Processing curve fitting
#============================
if LS.ReadAnddrawInputPoints(sorted_x,sorted_y,9): #plot the orginal data curve, set order=9
MatrixFactor = LS.produceFittingCurveFactors()
LS.outputFittingCurveFunction(MatrixFactor)
LS.drawFittedCurve(matAResult=MatrixFactor)