Funnel analysis is a set of process data analysis , It can scientifically reflect the user behavior state and the important analysis model of user conversion rate from the beginning to the end .
Funnel analysis is a commonly used data analysis model in the Internet industry , Data analysts often apply funnel model to flow monitoring 、 User transformation and other scenarios , So as to assist the decision-making of operation . As a beginner in the data industry , You may have heard of funnel analysis model many times , But I don't know how to apply funnel analysis model to business analysis .
Funnel analysis can visually present user behavior steps and the conversion rate between each step , Analyze the conversion rate between each step , It can provide opinions to assist the operation in decision-making ; Reduce “ Missing ” Of users , It can increase the business scale , Increase business volume . Take e-commerce transformation as an example , Users have a conversion path from browsing goods to paying orders , This transformation path can be regarded as a funnel , Because every step will miss a group of users , According to incomplete statistics, there are not enough users to pay orders 4%. If you want to increase the proportion of users who pay orders , Then there is no doubt that there is a need to reduce the number of users missing in each step , Analyze the reasons why users miss every key step , Improve the products one by one for each reason , So as to improve the conversion rate of users .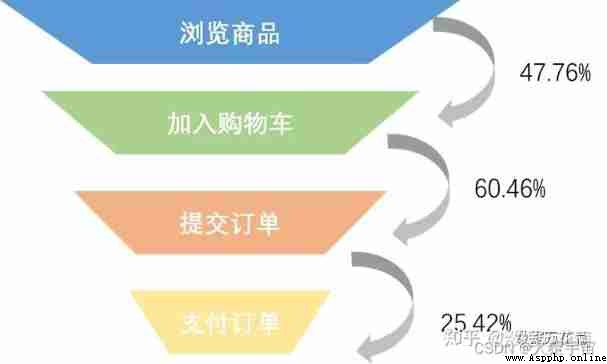
The four key elements of funnel analysis are the research object 、 Time 、 Nodes and indicators .
The research object is the dimension we analyze , For e-commerce, the commonly used dimensions are 、 cargo 、 site 、 Orders, etc ; Time is when the event starts and ends , That is, the time period when we apply the funnel model for research ; Nodes are the processes from the beginning of the event to the end of the event , Each step of the process is the key node of the event , Including the starting point 、 End points and process nodes , And cover the naming of these nodes 、 identification ; Indicators are tools for analyzing the whole event process , It is also the description and characterization of funnel , It describes the funnel model from the perspective of data , Can fully interpret the funnel model , Help find business problems , Guide business process optimization .
Corresponding to the four elements of funnel analysis , We summarize the core steps of funnel analysis as follows :
1. Identify research objects , Select the analysis dimension , That is, select the angle of data statistics , E-commerce common people 、 cargo 、 site 、 Orders, etc .
2. Determine the start and end time of the event , That is, the time period in which you want to apply the funnel model to the business .
3. Disassemble user path , Identify key nodes , That is, specify the node of each step of the user in the business .
4. Specify key indicators , Comprehensively depict the business , Guide business optimization , That is to interpret the current business situation and monitor the business development through data indicators .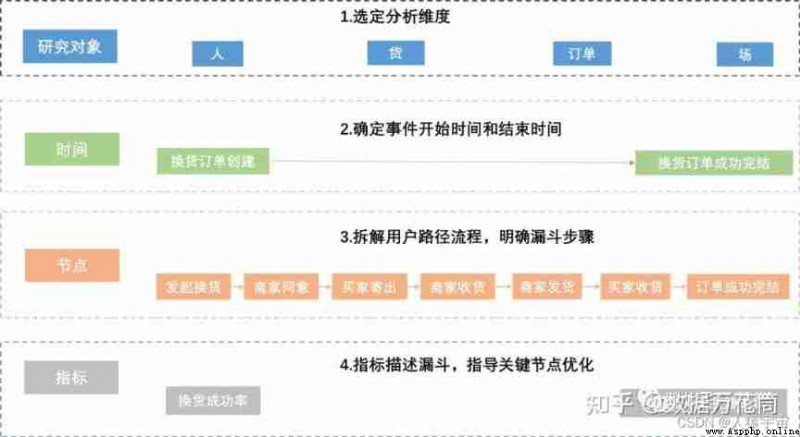
For what is funnel analysis , You must know the flow of funnel analysis like the back of your hand , However, how to use funnel analysis methodology in actual business needs to be illustrated by actual cases . We will take the reverse door-to-door pick-up and exchange business of Taobao as an example , Use funnel analysis method to analyze business problems and give certain solutions !
3.1 Business background introduction Taobao reverse includes three different forms of business
For consumers , Including door-to-door pick-up return and door-to-door pick-up exchange business ; For businesses, it's the interception business . The door-to-door pick-up and return business on the consumer side has matured , The door-to-door pick-up and exchange business has just begun , Therefore, it is necessary to systematically analyze the business of the modified module to find business problems , Optimize existing business , Improve the success rate of replacement and the penetration rate of door-to-door pick-up and replacement ! The business path of door-to-door pick-up and replacement is long , It involves two stages of logistics , There are two core indicators of its business path , The first is the success rate of exchange , That is, the ratio of successfully completed orders to the quantity sent by the buyer ; The second is the penetration rate of rookies , Also known as door-to-door pick-up and exchange penetration , In the exchange business, the ratio of the delivery volume of pick-up to that of the buyer .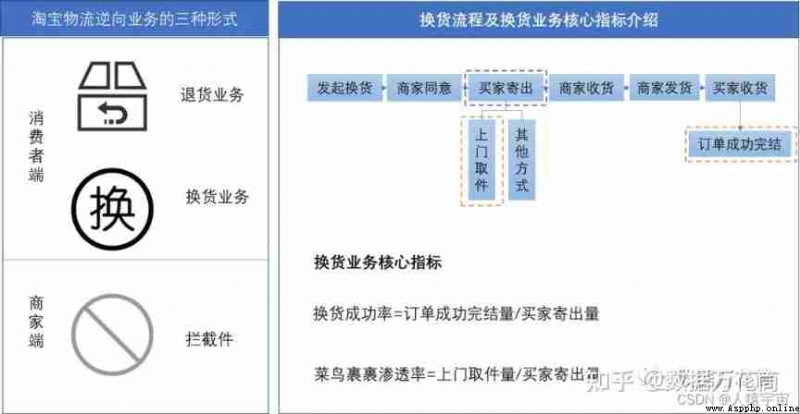
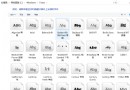
3.2 The establishment of business indicator system is for a new business , The first step is to establish a complete index system to reflect the current situation of the business and monitor the long-term development trend of the business .
For Taobao's reverse door-to-door pick-up and exchange business , The establishment of the index system is also disassembled according to the business process , Refine core indicators to monitor business development and changes . The index system of the door-to-door pick-up and exchange business includes the core indicators of all links from the launch of the exchange to the completion of the order , It also includes the core monitoring indicators of the whole business , for example , Exchange success rate and door-to-door pick-up exchange penetration rate . The specific index system is shown in the figure below .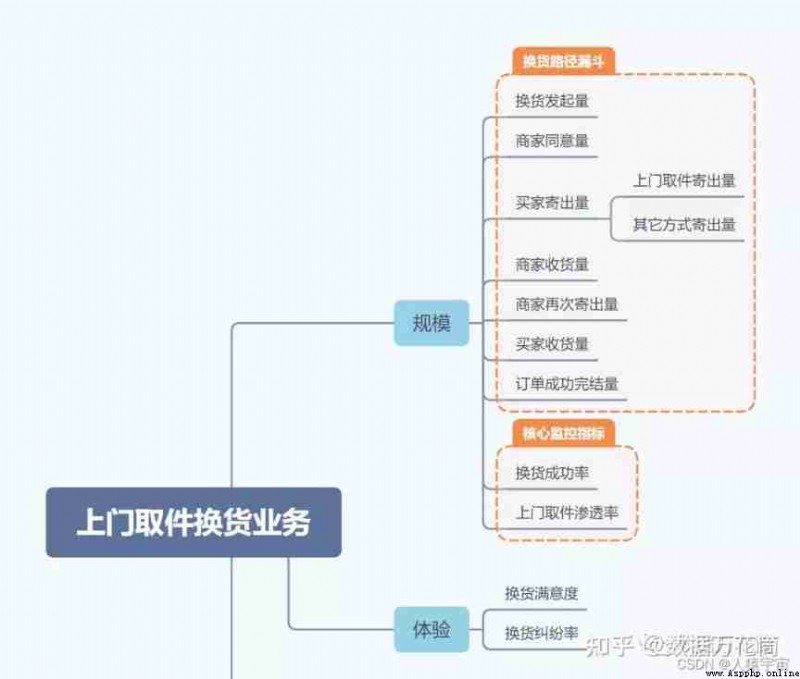
3.3 The summary of business status and the exploration of business problems have an index system , We can see the data of every step in the business funnel , And find the existing business problems of the business .
For the door-to-door pick-up and exchange business , There are two core problems .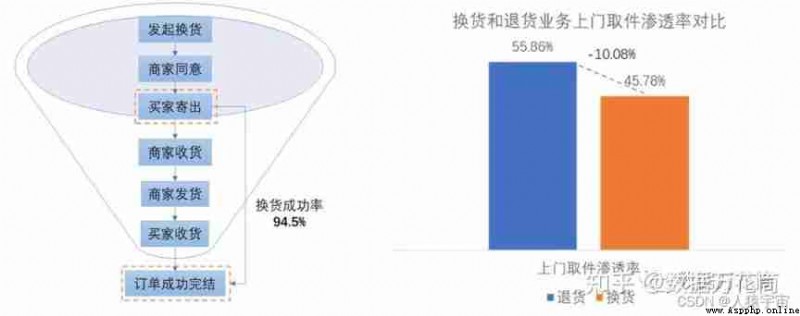
problem 1: Although the success rate of exchange is as high as 94.5%, But there is still room for improvement. The success rate of the exchange business is as high as 94.5%, But there are still 5.5% Of users missed , These users may have undergone process optimization 、 Product adjustment can be redeemed .
problem 2: There is still a certain gap between the penetration rate of door-to-door pick-up and replacement and that of similar businesses. The penetration rate of door-to-door pick-up and return business of similar businesses is as high as 55.86%, The penetration rate of door-to-door pick-up and exchange business is only 45.78%, The gap between the two is as high as 10.08%
3.4 Funnel analysis locates the problem of door-to-door pick-up and replacement business, facing the existing two business problems , We need to analyze and locate the key links and factors that affect the success rate of exchange and the penetration rate of door-to-door pick-up of exchange through funnel , In order to make corresponding improvement measures , Improve the success rate of replacement and the penetration rate of door-to-door pick-up .
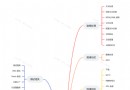
First , We analyze by order dimension , Draw the full funnel of the user's replacement path . This funnel includes the main flow of the exchange path , It also includes the branch routes of merchants and buyers on the exchange route . The main flow and branch flow of the funnel are closely linked , The previous steps will affect the subsequent steps , The result of the previous step will affect the performance of the next step . Through this user exchange path funnel , We can clearly see the relationship between important nodes , It is easier to clarify the factors that affect the success rate of exchange and the penetration rate of door-to-door pick-up of exchange .
secondly , We disassemble the two key indicators of exchange success rate and exchange door-to-door pick-up penetration into the user path funnel . According to the definition of exchange success rate , If “ The merchant refused to receive the goods ” as well as “ The buyer refused to accept the goods ” The order quantity of can be converted into “ Successfully completed orders ” Words , Then we can improve the success rate of exchange ; According to the definition of door-to-door pick-up penetration rate , If “ Buyer cancels ” as well as “ Timeout not sent ” If the order quantity can be sent by door-to-door pick-up , Then the penetration rate of door-to-door replacement can be improved . Only this and nothing more , We have identified the factors that affect the two key indicators . therefore , In the subsequent analysis, we will start to study “ The merchant refused to receive the goods ” as well as “ The buyer refused to accept the goods ” Why and “ Buyer cancels ” as well as “ Timeout not sent ” Why , So as to find the entry point to improve the success rate of exchange and the penetration rate of door-to-door pick-up of exchange .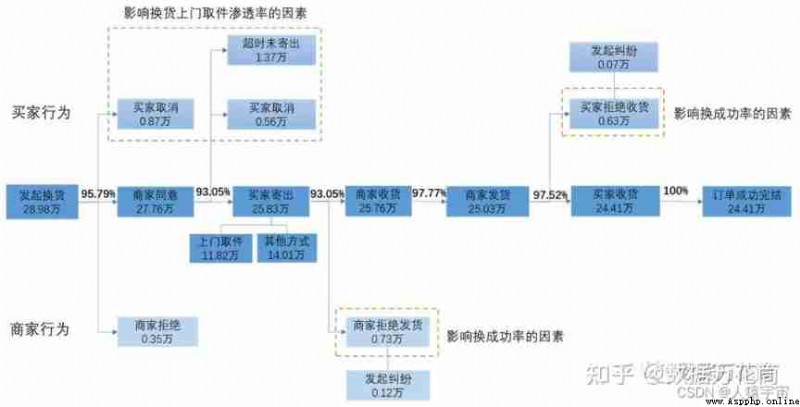
3.5 Based on experience and assumptions , Verify the specific reasons that affect the two key indicators - Factors affecting the success rate of exchange: the quantity of orders rejected by merchants is the influencing factor of the success rate of exchange , Finding out the specific reasons why merchants refuse to receive goods and taking corresponding measures can improve the success rate of exchange . The main reason why merchants refuse to deliver goods is that the goods are damaged 、 Incomplete trademarks 、 Exchange items are not all new , There are also some reasons for the wrong express delivery number . For goods reasons , We suggest launching inspection service ; As for the wrong express order number , We suggest to launch the number verification service . Buyers' refusal to receive goods is also one of the factors affecting the success rate of exchange , So we analyzed the repurchase rate of buyers who refused to receive the goods , It is found that the repurchase rate is as high as 54.31%, Therefore, we speculate that buyers prefer to return and buy again than exchange .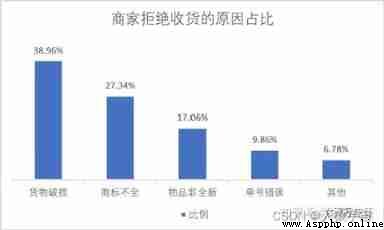
Factors affecting the penetration rate of door-to-door replacement. Canceling the replacement and not sending out in time out are the main factors affecting the penetration rate of door-to-door replacement . We have an in-depth discussion on the reasons why buyers cancel the exchange , It is found that the repurchase rate of users who cancel the exchange is still as high as 68.92%, It also shows that the buyer is compared with the exchange , Consumers prefer to return and buy again ; secondly , We found that the freight insurance coverage rate of orders that cancel the exchange is only 26.79%, Therefore, we speculate that insufficient freight insurance coverage is also one of the reasons why buyers cancel the exchange .
3.6 According to the data analysis, the feedback and suggestions
In order to improve the success rate of exchange and the penetration rate of door-to-door pick-up of exchange , Through funnel analysis, we locate the factors that affect these two key indicators and analyze the specific reasons , Finally, suggestions and suggestions for improvement are put forward according to the specific reasons .
The goods are damaged 、 Incomplete trademarks 、 The problem of non new products and other goods and the wrong logistics order number cause the merchant to refuse to receive the goods , Thus affecting the success rate of replacement . Therefore, we propose to launch the end courier inspection service and the platform to provide the number inspection service to reduce the number of orders that merchants refuse to receive , And then improve the success rate of exchange .
Buyers prefer to return and buy again than exchange , The specific performance is that the buyer chooses to repurchase after canceling the exchange and refusing to receive the goods , For this reason, we suggest to launch a replacement service similar to return and buy again , That is, two-way logistics fast exchange service , When the buyer applies for replacement, the merchant will deliver the goods immediately .
The main reason why the buyer didn't send the goods out of time is the low coverage of freight insurance , Therefore, we suggest to improve the coverage of freight insurance , At the same time, a door-to-door pick-up coupon is issued to the exchange user, and the user is reminded to send the goods in time by SMS .
This paper introduces the definition of funnel analysis 、 The core steps of funnel analysis and taking the door-to-door pick-up business of goods exchange as an example, gradually show how funnel analysis can be applied in business . It is worth noting that , Funnel analysis not only needs to clarify the main process of funnel , Moreover, the branch processes involved in the main process need to be sorted out , Because every time node 、 Each branch step may be the result of affecting the next step ; secondly , The core of funnel analysis is to formulate key monitoring indicators according to the funnel path and locate the specific reasons that affect the key indicators , Because only by finding out these reasons can we find the foothold of business optimization ; Last , When looking for the factors that affect the core monitoring indicators , Most cases are based on business experience and hypothesis verification , It is difficult to avoid the conclusion inconsistent with the assumption , It needs to be from multiple perspectives 、 Different dimensions and multiple hypothesis tests can find the foothold .
pyecharts Template with funnel diagram ( Click the link ), Just apply it .
Code
from pyecharts import options as opts
from pyecharts.charts import Funnel
data = [13543, 11413, 7909, 1366, 918, 151]
phase = [' Total number of visitors ', ' Number of active visitors ', ' Number of registered users ', ' Number of scheduled users ', ' Number of paid users ', ' Number of re purchase users ']
c = (
Funnel()
.add(" Stage ", [list(z) for z in zip(phase, data)])
.set_global_opts(title_opts=opts.TitleOpts(title=" Funnel diagram "))
.render("funnel.html")
)
chart 
Although drawing is convenient , But the aesthetic degree is average .
Use matplotlib The idea of drawing is , Draw two horizontal histograms , One of them is set as the background color to cover the part of the column length of the other , Then draw a polygon to fill the space between the two columns .
Code
import pandas as pd
import numpy as np
import matplotlib.pyplot as plt
import seaborn as sns
from matplotlib.patches import Polygon # Polygon() It can be used to pass in polygon vertices organized in order , So as to generate polygons
from matplotlib.collections import PatchCollection
plt.style.use('seaborn-dark') # Set the theme
plt.rcParams['font.sans-serif'] = ['SimHei'] # Used to display Chinese labels normally
plt.rcParams['axes.unicode_minus'] = False # Used to display negative sign normally
visitor_num = 135043
data = [135043, 113413, 74909, 10366, 9018, 4151]
phase = [' Total number of visitors ', ' Number of active visitors ', ' Number of registered users ', ' Number of scheduled users ', ' Number of paid users ', ' Number of re purchase users ']
data1 = [visitor_num/2 - i/2 for i in data]
data2 = [i+j for i,j in zip(data, data1)]
color_list = [ '#5c1d1d', '#892c2c','#994a4a', '#c56161', '#d48989', '#e2b0b0'] # The color of the pillars
fig,ax = plt.subplots(figsize=(16, 9),facecolor='#f4f4f4')
ax.barh(phase[::-1], data2[::-1], color = color_list, height=0.7) # The column width is set to 0.7
ax.barh(phase[::-1], data1[::-1], color = '#f4f4f4', height=0.7) # Set the same color as the background
ax.axis('off')
polygons = []
for i in range(len(data)):
# Stage
ax.text(
0, # coordinate
i, # Height
phase[::-1][i], # Text
color='black', alpha=0.8, size=16, ha="right")
# Number
ax.text(
data2[0] / 2 ,
i,
str(data[::-1][i]) +'(' +str(round(data[::-1][i] / data[0] * 100, 1)) + '%)',
color='black', alpha=0.8, size=18, ha="center")
if i < 5:
# The proportion
ax.text(
data2[0] / 2 ,
4.4 - i,
str(round(data[i+1] / data[i], 3) * 100) + '%',
color='black', alpha=0.8, size=16, ha="center")
# Draw polygon
polygons.append(Polygon(xy=np.array([(data1[i+1], 4+0.35-i), # Because the width of the histogram is set to 0.7, So half is 0.35
(data2[i+1], 4+0.35-i),
(data2[i], 5-0.35-i),
(data1[i], 5-0.35-i)])))
# Use add_collection And PatchCollection Come to Axes Add a polygon to the image
ax.add_collection(PatchCollection(polygons,
facecolor='#e2b0b0',
alpha=0.8));
plt.show()
chart 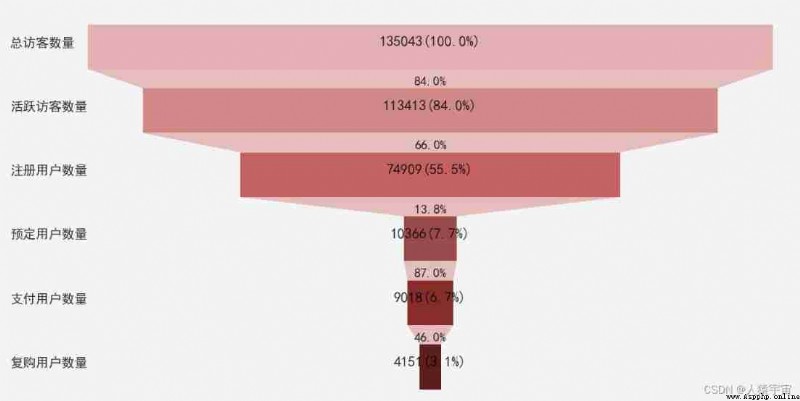
Looks sloppy , But the code is cumbersome
ploty There is an existing library , More beautiful , Template of funnel diagram ([ Click the link ]).
Plotly It is an online platform for data analysis and visualization , Very powerful , You can draw a lot of graphs online, such as bar graphs 、 Scatter plot 、 The pie chart 、 Histogram and so on . It also supports online editing , And many languages python、javascript、matlab、R Wait a lot API. It's in python It's easy to use in , Direct use pip install plotly That's all right. . Use Plotly Can draw a lot like Tableau High quality map of :
The foundation funnel
import plotly.express as px
data = dict(
number=[39, 27.4, 20.6, 11, 2],
stage=["Website visit", "Downloads", "Potential customers", "Requested price", "invoice sent"])
fig = px.funnel(data, x='number', y='stage')
fig.show()
chart 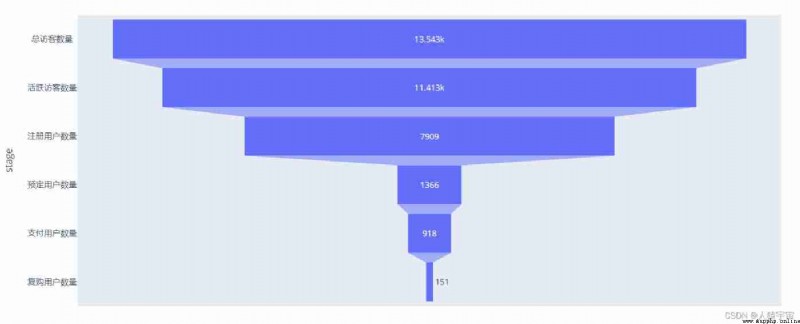
Stacking funnel diagram
import plotly.express as px
import pandas as pd
stages = ["Website visit", "Downloads", "Potential customers", "Requested price", "invoice sent"]
df_mtl = pd.DataFrame(dict(number=[39, 27.4, 20.6, 11, 3], stage=stages))
df_mtl['office'] = 'Montreal'
df_toronto = pd.DataFrame(dict(number=[52, 36, 18, 14, 5], stage=stages))
df_toronto['office'] = 'Toronto'
df = pd.concat([df_mtl, df_toronto], axis=0)
fig = px.funnel(df, x='number', y='stage', color='office')
fig.show()
chart 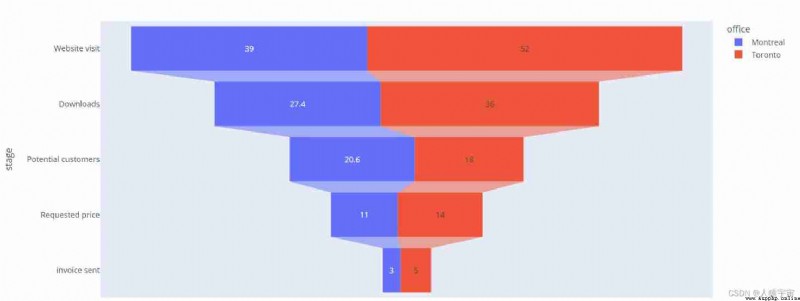
Funnel chart with various indicators
from plotly import graph_objects as go
fig = go.Figure(go.Funnel(
y = ["Website visit", "Downloads", "Potential customers", "Requested price", "invoice sent"],
x = [39, 27.4, 20.6, 11, 2]))
fig.show()
chart 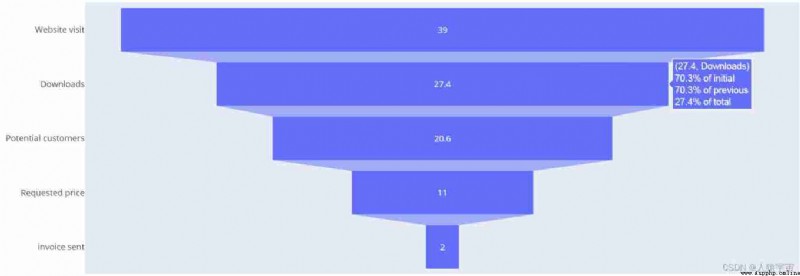
Hover the mouse over the figure to see the proportion of each item in the current stage
Funnel chart custom colors
from plotly import graph_objects as go
fig = go.Figure(go.Funnel(
y = ["Website visit", "Downloads", "Potential customers", "Requested price", "Finalized"],
x = [39, 27.4, 20.6, 11, 2],
textposition = "inside",
textinfo = "value+percent initial",
opacity = 0.65, marker = {
"color": ["deepskyblue", "lightsalmon", "tan", "teal", "silver"],
"line": {
"width": [4, 2, 2, 3, 1, 1], "color": ["wheat", "wheat", "blue", "wheat", "wheat"]}},
connector = {
"line": {
"color": "royalblue", "dash": "dot", "width": 3}})
)
fig.show()
chart 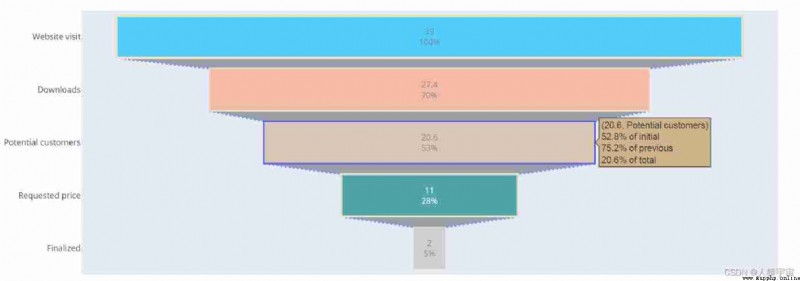
Stacking funnel chart with various indicators
from plotly import graph_objects as go
fig = go.Figure()
fig.add_trace(go.Funnel(
name = 'Montreal',
y = ["Website visit", "Downloads", "Potential customers", "Requested price"],
x = [120, 60, 30, 20],
textinfo = "value+percent initial"))
fig.add_trace(go.Funnel(
name = 'Toronto',
orientation = "h",
y = ["Website visit", "Downloads", "Potential customers", "Requested price", "invoice sent"],
x = [100, 60, 40, 30, 20],
textposition = "inside",
textinfo = "value+percent previous"))
fig.add_trace(go.Funnel(
name = 'Vancouver',
orientation = "h",
y = ["Website visit", "Downloads", "Potential customers", "Requested price", "invoice sent", "Finalized"],
x = [90, 70, 50, 30, 10, 5],
textposition = "outside",
textinfo = "value+percent total"))
fig.show()
chart 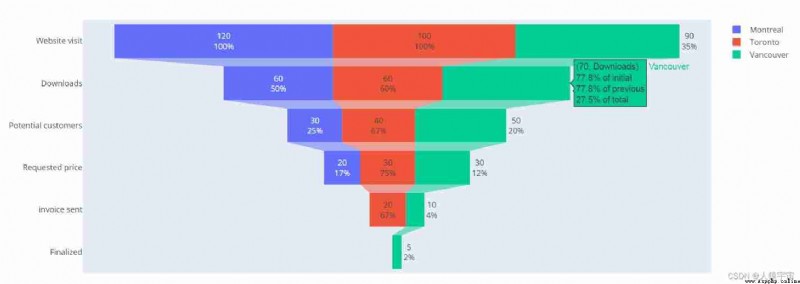
It's pretty , The code is also relatively simple and clear
Data analysis is inseparable from data visualization . The one we use most often is pandas,matplotlib,pyecharts,plotly Of course, Tableau, How to apply , You can choose according to your needs and actual situation