Usage method
add to label Of
Draw a dotted line
level
Set color and line width
Other settings
Usage methodmatplotlib.pyplot.contour(*args, data=None, **kwargs)Parameter Introduction :
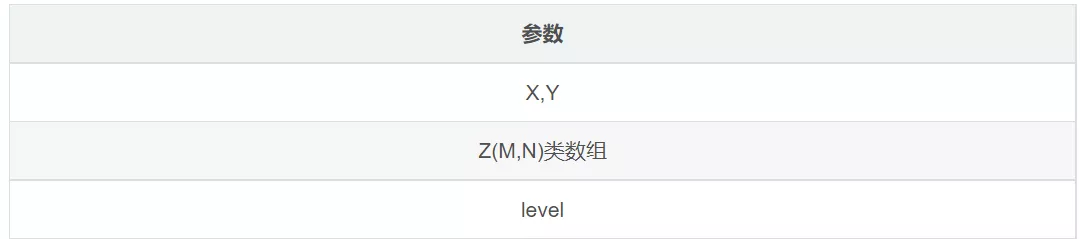
Parameters X,YZ(M,N) An array of class level
import numpy as npimport matplotlib.pyplot as pltX, Y = np.meshgrid(np.linspace(-3,3,256), np.linspace(-3,3,256))Z = (1 - X/2 + X**5 + Y**3) * np.exp(-X**2 - Y**2)levels = np.linspace(np.min(Z), np.max(Z), 7)fig, ax = plt.subplots()ax.contour(X, Y, Z, levels=levels)plt.show()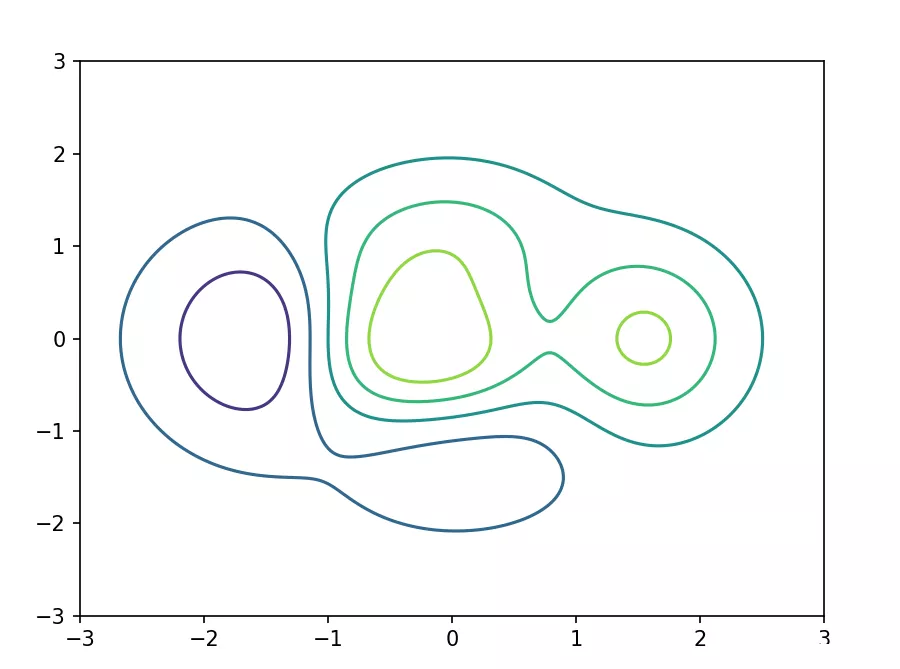
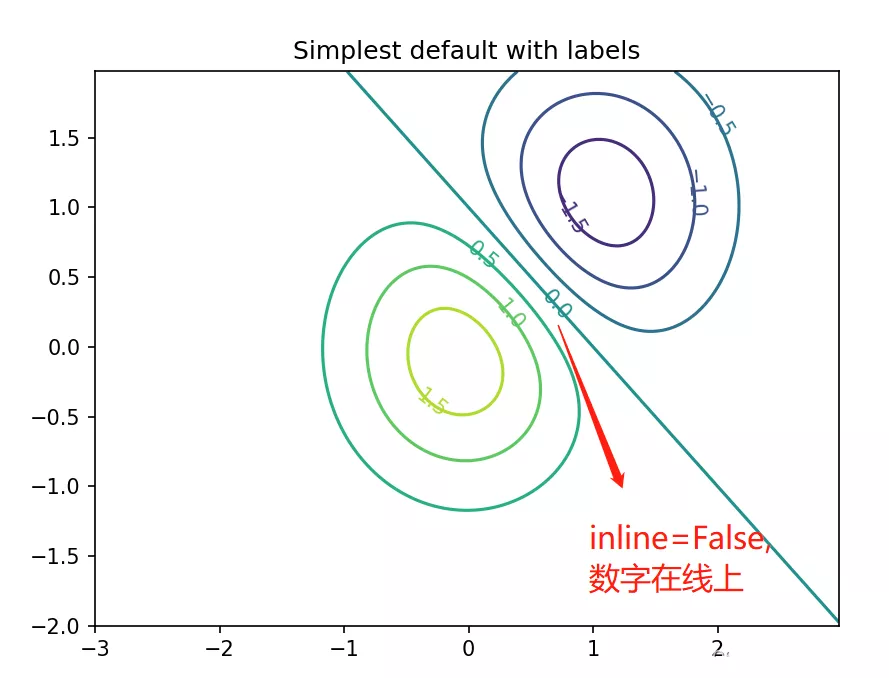
What needs to live is inline Parameters . The default is inline=True
import numpy as npimport matplotlib.cm as cmimport matplotlib.pyplot as pltdelta = 0.025x = np.arange(-3.0, 3.0, delta)y = np.arange(-2.0, 2.0, delta)X, Y = np.meshgrid(x, y)Z1 = np.exp(-X**2 - Y**2)Z2 = np.exp(-(X - 1)**2 - (Y - 1)**2)Z = (Z1 - Z2) * 2fig, ax = plt.subplots()CS = ax.contour(X, Y, Z)ax.clabel(CS, inline=True, fontsize=10)ax.set_title('Simplest default with labels')plt.show()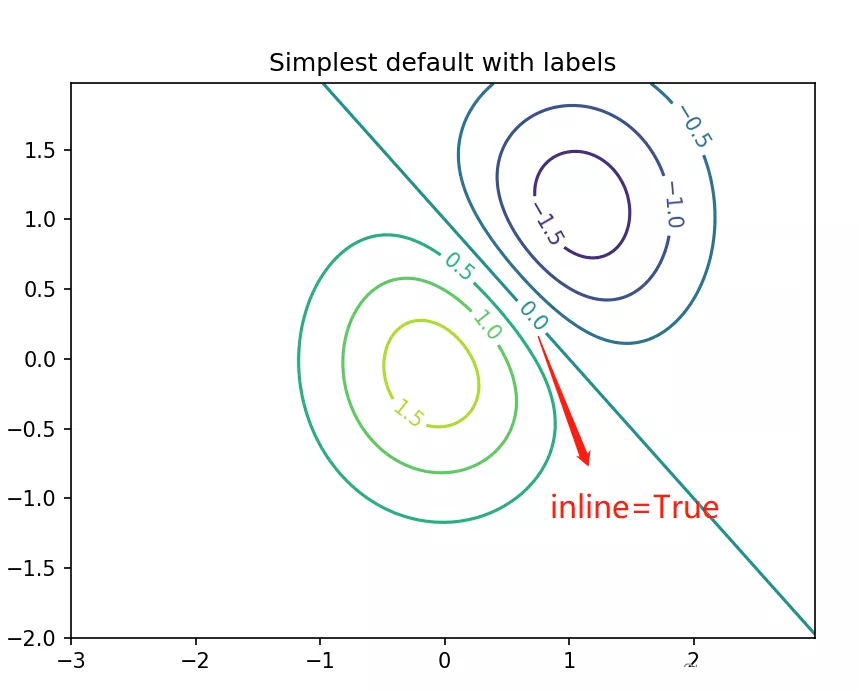
import numpy as npimport matplotlib.cm as cmimport matplotlib.pyplot as pltdelta = 0.025x = np.arange(-3.0, 3.0, delta)y = np.arange(-2.0, 2.0, delta)X, Y = np.meshgrid(x, y)Z1 = np.exp(-X**2 - Y**2)Z2 = np.exp(-(X - 1)**2 - (Y - 1)**2)Z = (Z1 - Z2) * 2fig, ax = plt.subplots()CS = ax.contour(X, Y, Z, 6, colors='k')ax.clabel(CS, fontsize=9, inline=True)ax.set_title('Single color - negative contours dashed')plt.show()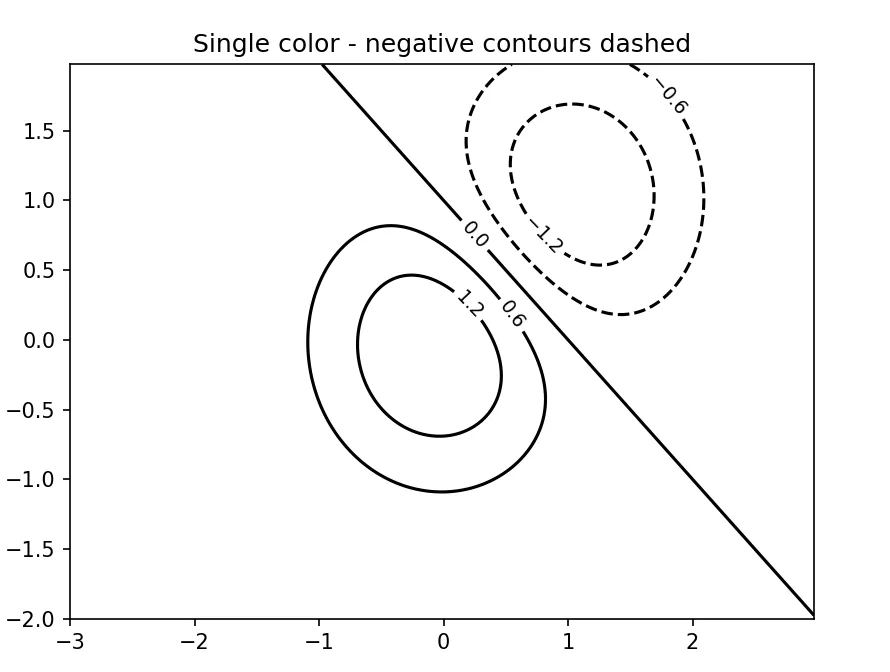
Determine the number of contours / Location , Choose not to exceed n+1 individual " good " Contour level
import numpy as npimport matplotlib.cm as cmimport matplotlib.pyplot as pltdelta = 0.025x = np.arange(-3.0, 3.0, delta)y = np.arange(-2.0, 2.0, delta)X, Y = np.meshgrid(x, y)Z1 = np.exp(-X**2 - Y**2)Z2 = np.exp(-(X - 1)**2 - (Y - 1)**2)Z = (Z1 - Z2) * 2fig, axs = plt.subplots(nrows=1, ncols=2, figsize=(14,7))axs[0].set_title('levels=6')CS = axs[0].contour(X, Y, Z, 6, colors='k')axs[0].clabel(CS, fontsize=9, inline=True)axs[1].set_title('levels=10')CS1 = axs[1].contour(X, Y, Z, 10, colors='k')axs[1].clabel(CS1, fontsize=9, inline=True)plt.show()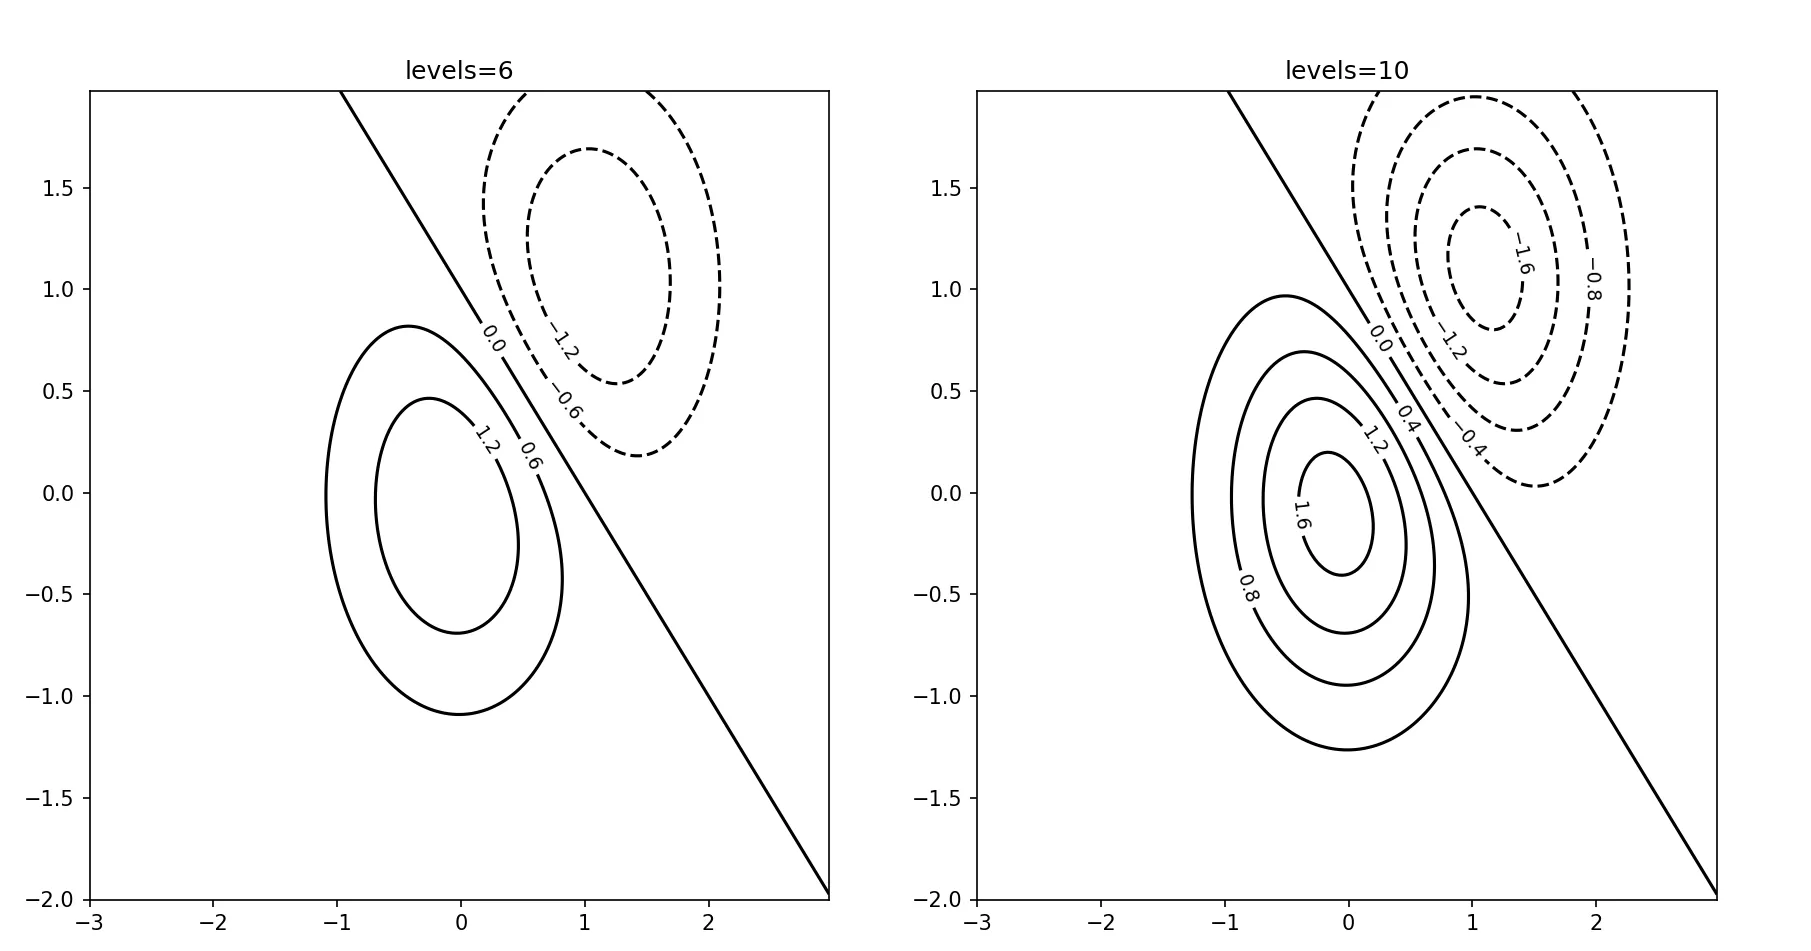
import numpy as npimport matplotlib.cm as cmimport matplotlib.pyplot as pltdelta = 0.025x = np.arange(-3.0, 3.0, delta)y = np.arange(-2.0, 2.0, delta)X, Y = np.meshgrid(x, y)Z1 = np.exp(-X**2 - Y**2)Z2 = np.exp(-(X - 1)**2 - (Y - 1)**2)Z = (Z1 - Z2) * 2fig, ax = plt.subplots()CS = ax.contour(X, Y, Z, 6, linewidths=np.arange(.5, 4, .5), colors=('r', 'cyan', 'blue', (1, 1, 0), '#afeeee', '0.5'), )ax.clabel(CS, fontsize=9, inline=True)ax.set_title('Crazy lines')plt.show()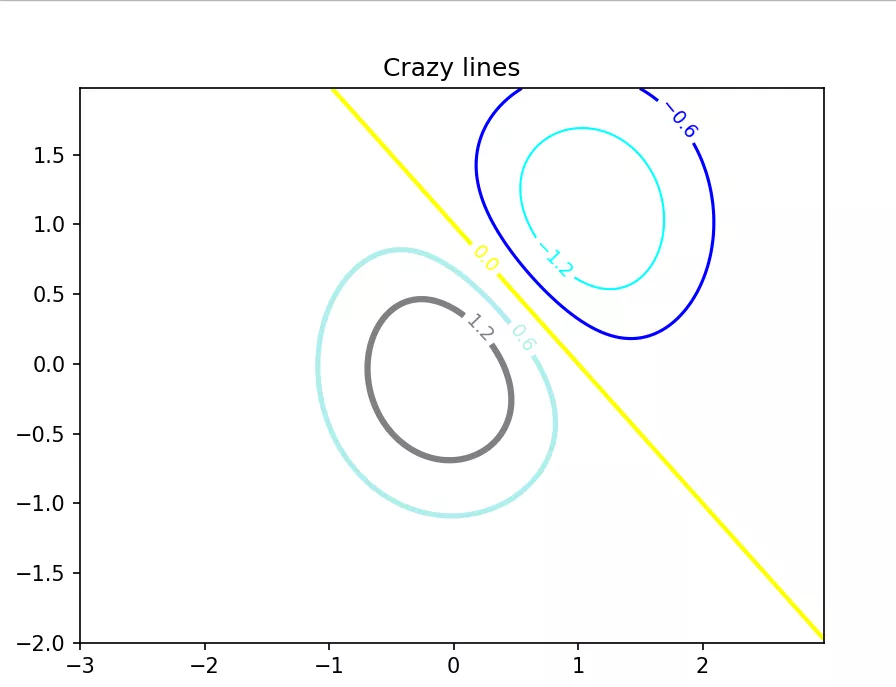
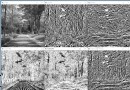
import numpy as npimport matplotlib.cm as cmimport matplotlib.pyplot as pltdelta = 0.025x = np.arange(-3.0, 3.0, delta)y = np.arange(-2.0, 2.0, delta)X, Y = np.meshgrid(x, y)Z1 = np.exp(-X**2 - Y**2)Z2 = np.exp(-(X - 1)**2 - (Y - 1)**2)Z = (Z1 - Z2) * 2fig, ax = plt.subplots()im = ax.imshow(Z, interpolation='bilinear', origin='lower', cmap=cm.gray, extent=(-3, 3, -2, 2))levels = np.arange(-1.2, 1.6, 0.2)CS = ax.contour(Z, levels, origin='lower', cmap='flag', extend='both', linewidths=2, extent=(-3, 3, -2, 2))CS.collections[6].set_linewidth(4)ax.clabel(CS, levels[1::2], # label every second level inline=True, fmt='%1.1f', fontsize=14)CB = fig.colorbar(CS, shrink=0.8)ax.set_title('Lines with colorbar')CBI = fig.colorbar(im, orientation='horizontal', shrink=0.8)l, b, w, h = ax.get_position().boundsll, bb, ww, hh = CB.ax.get_position().boundsCB.ax.set_position([ll, b + 0.1*h, ww, h*0.8])plt.show()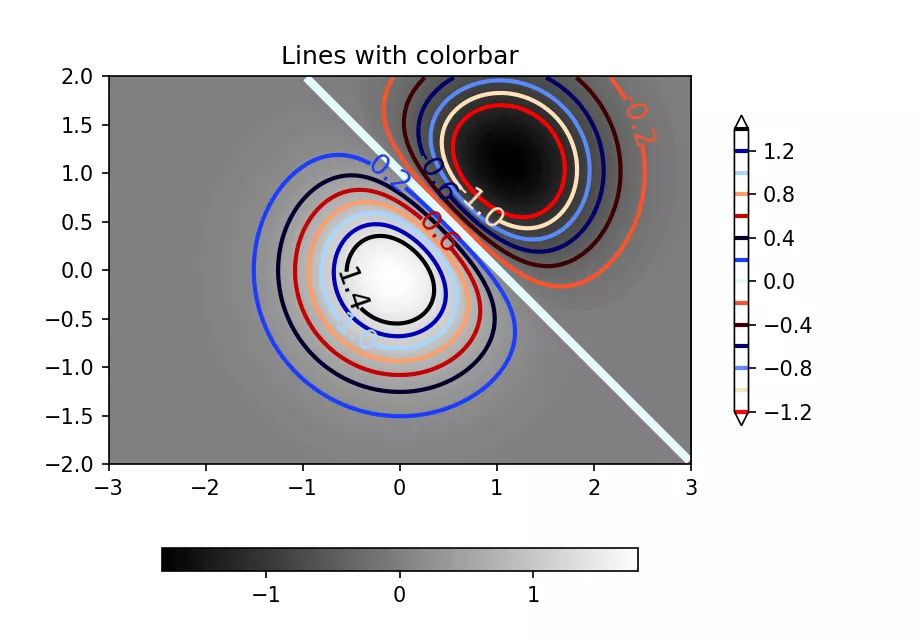
This is about how to use python This is the end of the article on drawing contour map , More about python Please search the previous articles of the software development network or continue to browse the following related articles. I hope you can support the software development network in the future !