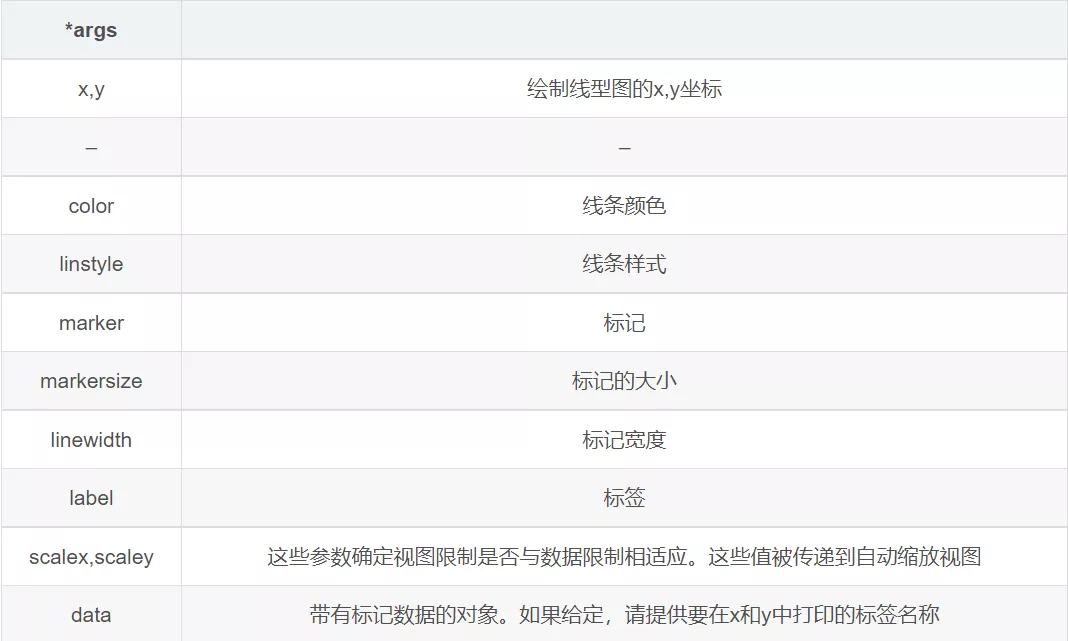
x,y
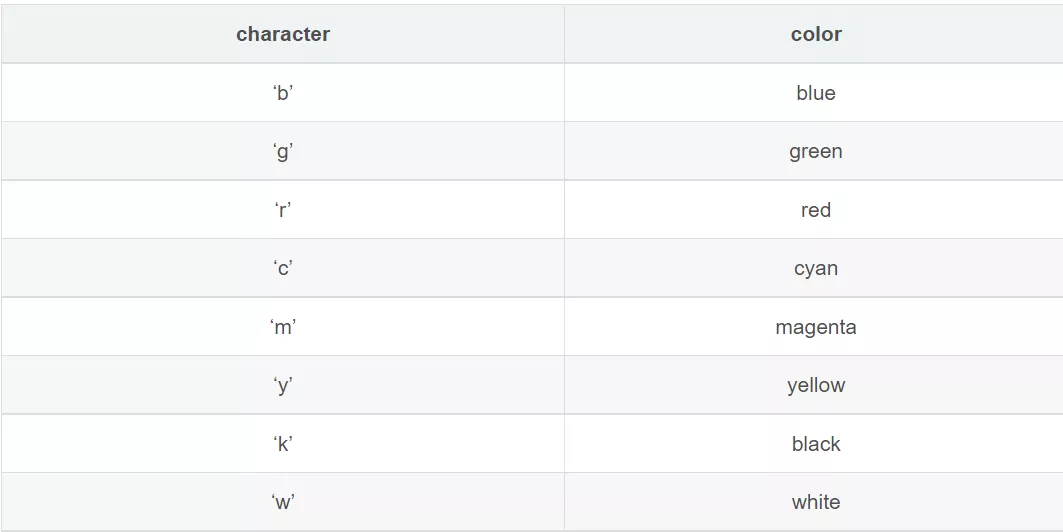
color
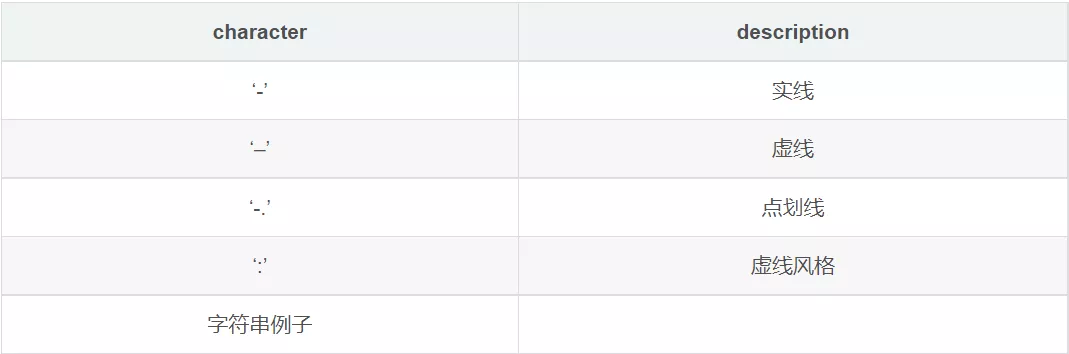
linstyle
Abbreviation way
marker, markersize
label
Draw three lines at one time
usage :
matplot.pyplot.plot(*args, scalex=True, scaley=True, data=None, **kwargs)Parameter interpretation :
import numpy as npimport matplotlib.pyplot as pltx = np.arange(0.2, 2.0, 0.01)y1 = np.sin(2*np.pi*x)y2 = np.sin(4*np.pi*x)plt.figure(1)plt.subplot(211)plt.plot(x,y1)plt.subplot(212)plt.plot(x,y2)plt.show()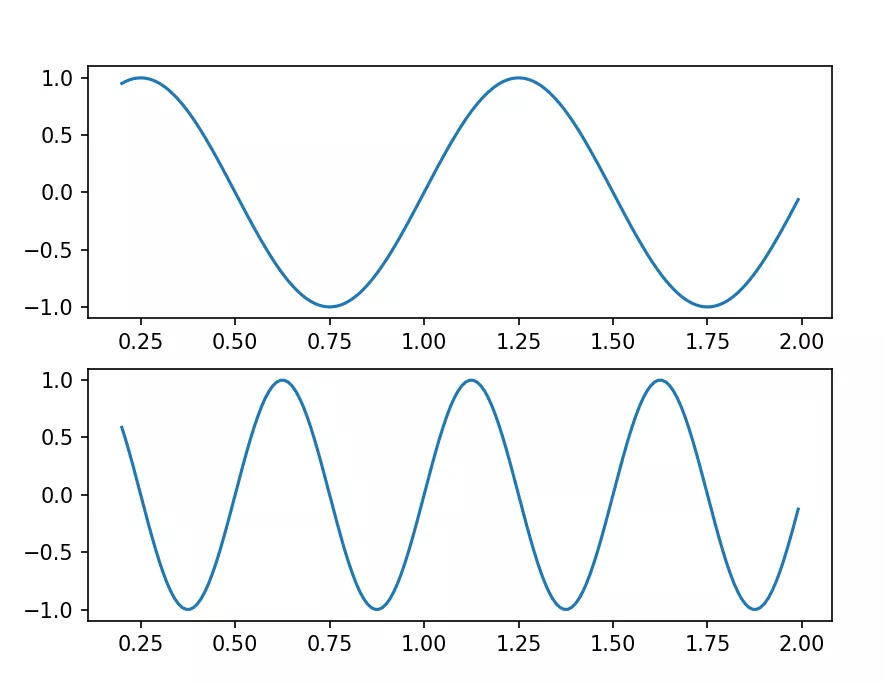
Colors Value :
import numpy as npimport matplotlib.pyplot as plt# Need to explain , The following two lines of code are to prevent the occurrence of Chinese , Report warning # Because of our title It's written in Chinese plt.rcParams['font.family'] = 'SimHei'plt.rcParams['axes.unicode_minus']=Falsex = np.arange(0.2, 2.0, 0.01)y1 = np.sin(2*np.pi*x)y2 = np.sin(4*np.pi*x)plt.figure(1)plt.subplot(211)plt.title(' No color ')plt.plot(x,y1)plt.subplot(212)plt.title(' Adding color ')plt.plot(x,y2,color='c')plt.show()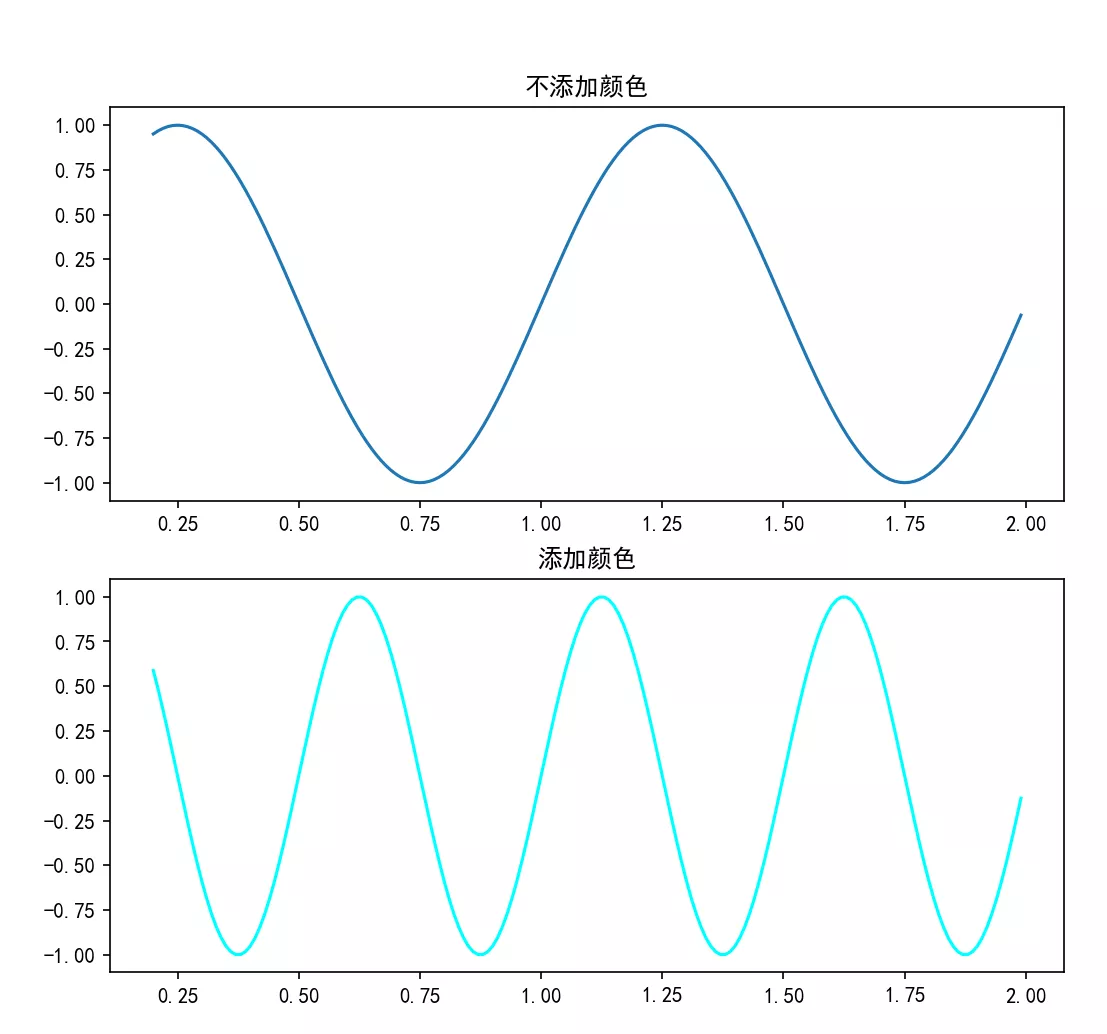
'b' # blue markers with default shape'or' # red circles'-g' # green solid line'--' # dashed line with default color'^k:' # black triangle_up markers connected by a dotted lineimport numpy as npimport matplotlib.pyplot as pltplt.figsize=((10,8))plt.rcParams['font.family'] = 'SimHei'plt.rcParams['axes.unicode_minus']=Falsex = [1, 2, 3, 4]y = [1, 4, 9, 16]plt.subplot(221)plt.title(' style : -')plt.plot(x,y,'-')plt.subplot(222)plt.title(' style : --')plt.plot(x,y,'--')plt.subplot(223)plt.title(' style : -.')plt.plot(x, y, '-.')plt.subplot(224)plt.title(' style : :')plt.plot(x, y, ':')plt.show()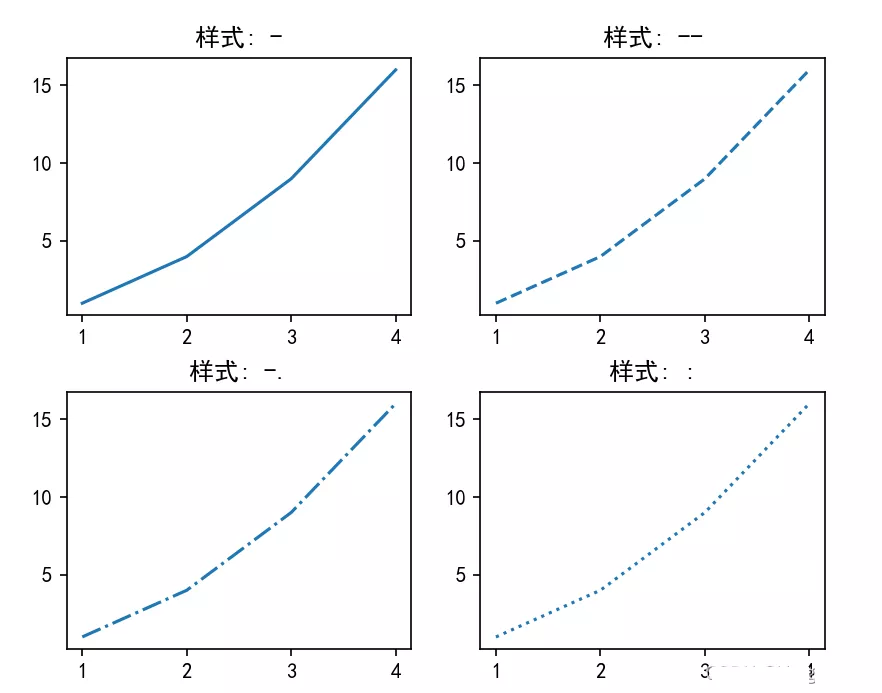
import numpy as npimport matplotlib.pyplot as pltx = [1, 2, 3, 4]y = [1, 4, 9, 16]plt.subplot()# Line shape '-', Color 'g'plt.plot(x, y, '-g')plt.show()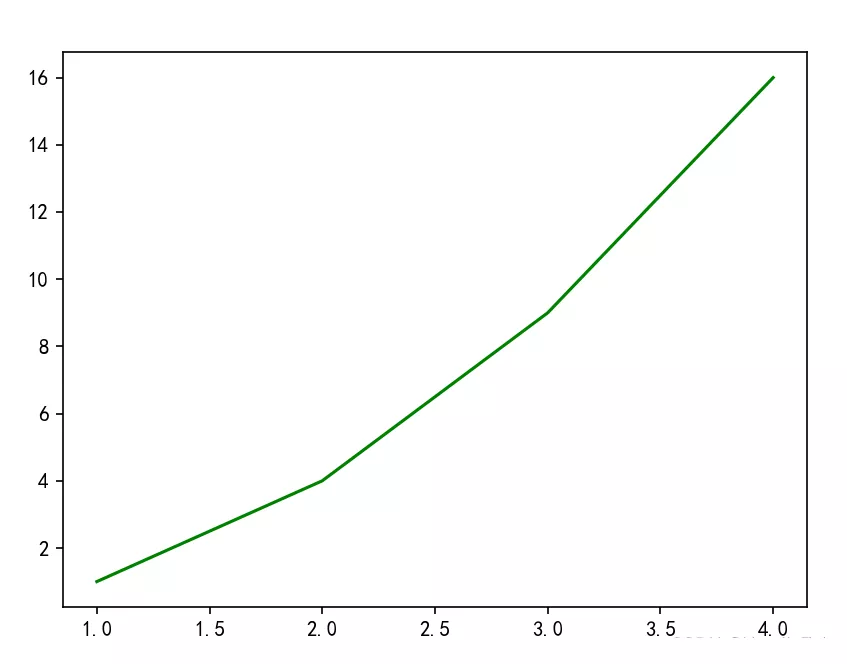
marker stay scatter I've explained something in it , There are many situations , Can be in scatter The scatter plot here will combine the color and marker Connect , Can have a very clear understanding , And more clearly , It's also an abbreviation
import matplotlib.pyplot as pltplt.figsize=((12,6))plt.rcParams['font.family'] = 'SimHei'plt.rcParams['axes.unicode_minus']=Falsex = [1, 2, 3, 4]y = [1, 4, 9, 16]plt.subplot(131)plt.title(' By default ')plt.plot(x, y)plt.subplot(132)plt.title(' Red circle ')# marker by o Color rplt.plot(x, y, 'or')plt.subplot(133)plt.title(' Triangle black ')# marker by ^ Color k->blackplt.plot(x, y, '^k')plt.show()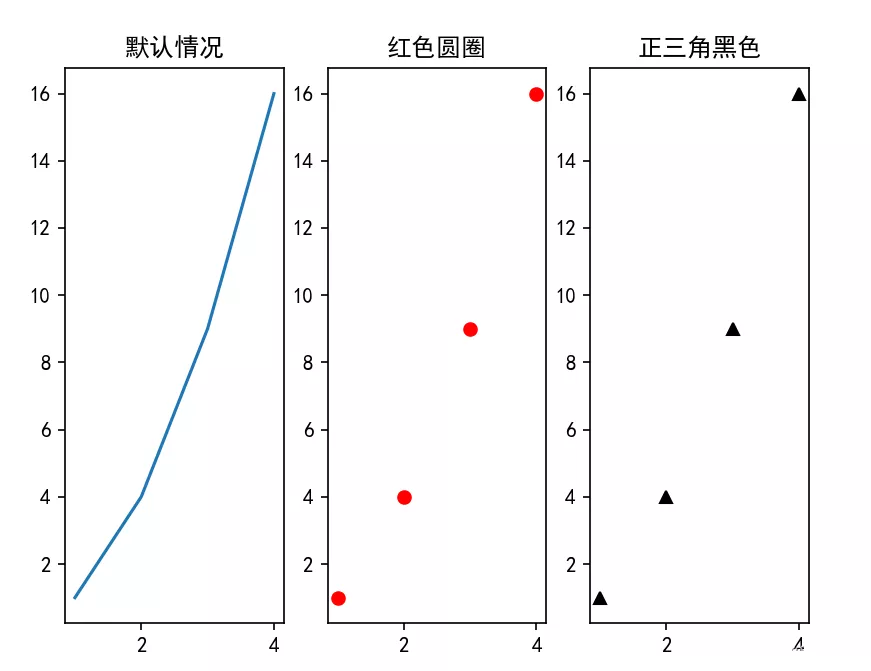
label , This can be used in all graphics , Show me here , Including the previous alpha It's also , All belong to **kwargs Inside , You can add... To any drawing ,legend Is a legend
import matplotlib.pyplot as pltimport numpy as npx = np.linspace(-np.pi/2, np.pi/2, 31)y = np.cos(x)**3# 1) remove points where y > 0.7x2 = x[y <= 0.7]y2 = y[y <= 0.7]# 2) mask points where y > 0.7y3 = np.ma.masked_where(y > 0.7, y)# 3) set to NaN where y > 0.7y4 = y.copy()y4[y3 > 0.7] = np.nanplt.plot(x*0.1, y, 'o-', color='lightgrey', label='No mask')plt.plot(x2*0.4, y2, 'o-', label='Points removed')plt.plot(x*0.7, y3, 'o-', label='Masked values')plt.plot(x*1.0, y4, 'o-', label='NaN values')plt.legend()plt.show()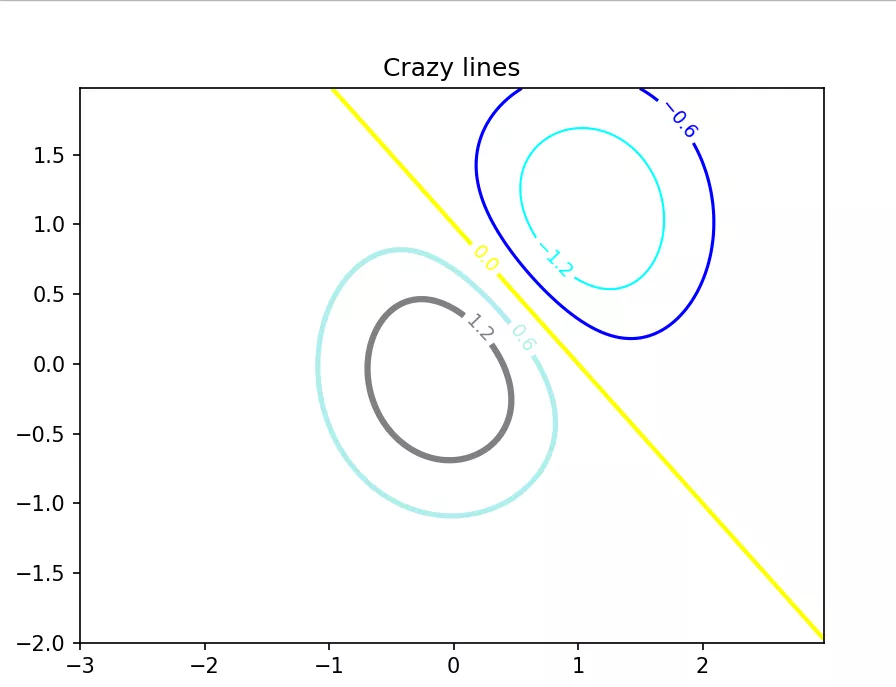
Here are some cases
Draw three lines at one timeimport numpy as npimport matplotlib.pyplot as pltt = np.arange(0., 5., 0.2)# Red dotted line , Blue Square , Light blue hexagon plt.plot(t, t, 'r--', t, t**2, 'bs', t, t**3, 'cH')plt.show()
import numpy as npimport matplotlib.pyplot as pltx1 = np.linspace(0.0, 5.0)y1 = np.cos(2 * np.pi * x1) * np.exp(-x1)x2 = np.linspace(0.0, 2.0)y2 = np.cos(2 * np.pi * x2)plt.subplot(211)plt.plot(x1, y1, 'o-')plt.subplot(212)plt.plot(x1, y1, '.-')plt.show()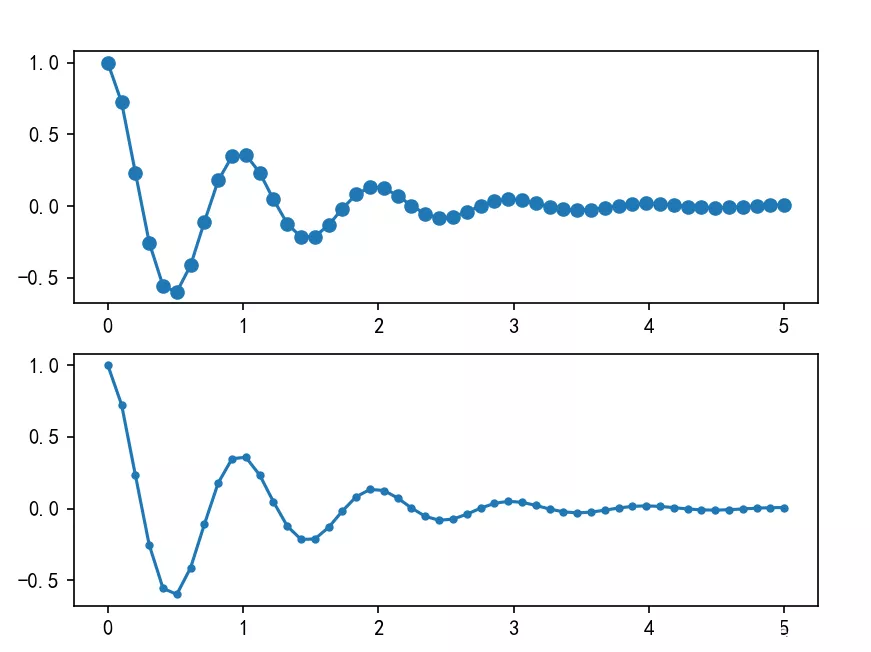
This is about using python This is the end of the article on drawing line graphs , More about python Please search the previous articles of SDN or continue to browse the related articles below. I hope you will support SDN more in the future !