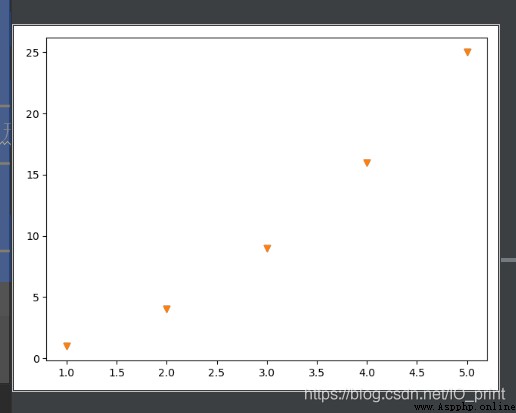
Draw a scatter plot
import matplotlib.pyplot as plt
x_values = [1, 2, 3, 4, 5]
y_values = [1, 4, 9, 16, 25]
# Draw a scatter plot
# plt.scatter(x_values, y_values, s=100)
plt.scatter(x_values, y_values, marker='v') #marker To display the shape of drawing points D The diamond o function v triangle
plt.show()
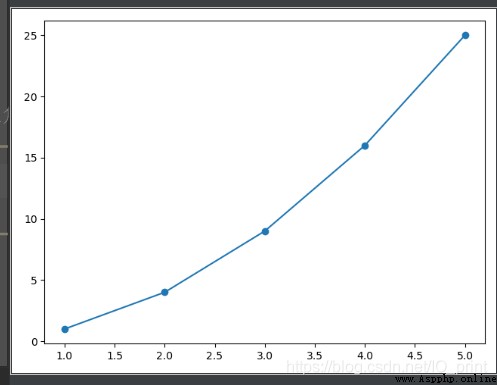
Draw line chart
import matplotlib.pyplot as plt
x_values = [1, 2, 3, 4, 5]
y_values = [1, 4, 9, 16, 25]
# Broken line diagram
# Format :plt.plot(x,y)
plt.plot(x_values, y_values, marker='o')
plt.show()
Realize dynamic drawing
import matplotlib.pyplot as plt
import random
plt.ion() # Turn on interactive mode The key to success
plt.figure(1)
t = [0]
y = [0]
for i in range(2000):
plt.clf() # Empty everything on the canvas
t.append(random.randint(1, 10))
y.append(random.randint(1, 10))
plt.plot(t, y, '-r')
plt.pause(0.01)