Basic usage
Case study
complex fille_between( Case source: official website )
where and interpolate
where
interpolate
step
usage :
Axes.fill_between(x, y1, y2=0, where=None, interpolate=False, step=None, *, data=None, **kwargs)Parameter description :

import matplotlib.pyplot as pltimport numpy as npx = [1, 2, 3, 4, 5]y1 = [1, 4, 9, 16, 25]y2 = [9, 9, 9, 9, 9]fig, (ax1, ax2) = plt.subplots(1,2)ax1.fill_between(x, y1, alpha=.5, linewidth=0)ax1.set_title(' fill x,y1 Between ')ax2.fill_between(x, y2, alpha=.5, linewidth=1)ax2.set_title(' fill x,y2 Between ')plt.show()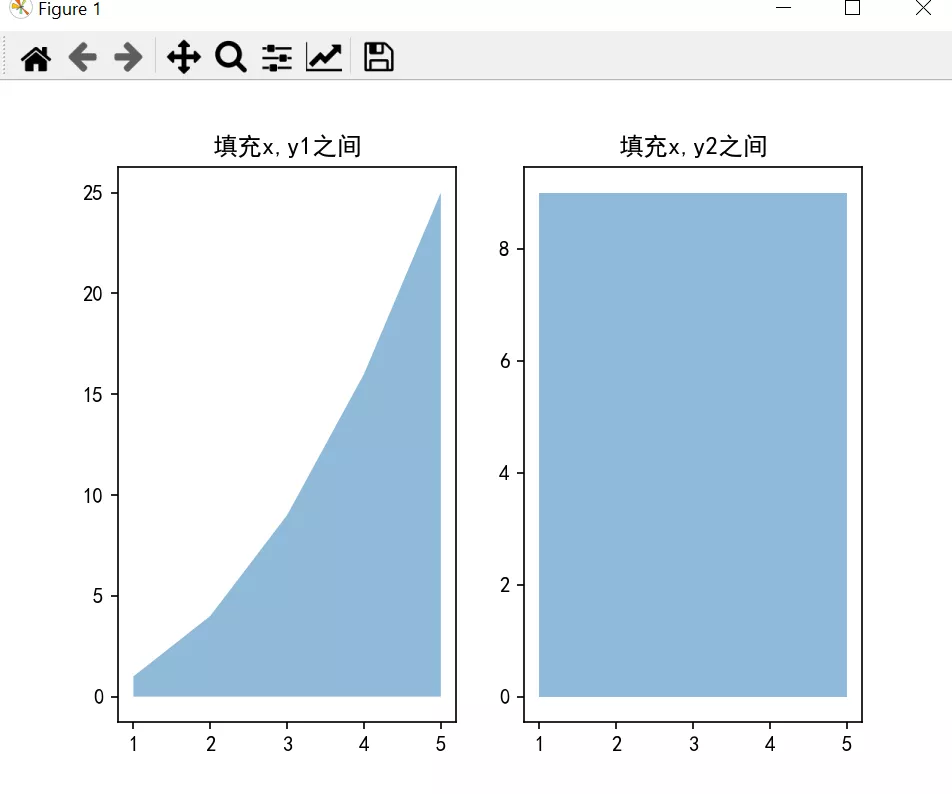
Of course, it doesn't make much sense , Just want to show a clear filling , Similar to the area full fill color
Case studyimport matplotlib.pyplot as pltimport numpy as npnp.random.seed(1)x = np.linspace(0, 8, 16)y1 = 3 + 4*x/8 + np.random.uniform(0.0, 0.5, len(x))y2 = 1 + 2*x/8 + np.random.uniform(0.0, 0.5, len(x))fig, ax = plt.subplots()ax.fill_between(x, y1, y2, alpha=.5, linewidth=0)ax.plot(x, (y1 + y2)/2, linewidth=2)ax.set(xlim=(0, 8), xticks=np.arange(1, 8), ylim=(0, 8), yticks=np.arange(1, 8))plt.show()
import numpy as npimport matplotlib.pyplot as pltNsteps, Nwalkers = 100, 250t = np.arange(Nsteps)# an (Nsteps x Nwalkers) array of random walk stepsS1 = 0.004 + 0.02*np.random.randn(Nsteps, Nwalkers)S2 = 0.002 + 0.01*np.random.randn(Nsteps, Nwalkers)# an (Nsteps x Nwalkers) array of random walker positionsX1 = S1.cumsum(axis=0)X2 = S2.cumsum(axis=0)# Nsteps length arrays empirical means and standard deviations of both# populations over timemu1 = X1.mean(axis=1)sigma1 = X1.std(axis=1)mu2 = X2.mean(axis=1)sigma2 = X2.std(axis=1)# plot it!fig, ax = plt.subplots(1)ax.plot(t, mu1, lw=2, label='mean population 1')ax.plot(t, mu2, lw=2, label='mean population 2')ax.fill_between(t, mu1+sigma1, mu1-sigma1, facecolor='C0', alpha=0.4)ax.fill_between(t, mu2+sigma2, mu2-sigma2, facecolor='C1', alpha=0.4)ax.set_title(r'random walkers empirical $\mu$ and $\pm \sigma$ interval')ax.legend(loc='upper left')ax.set_xlabel('num steps')ax.set_ylabel('position')ax.grid()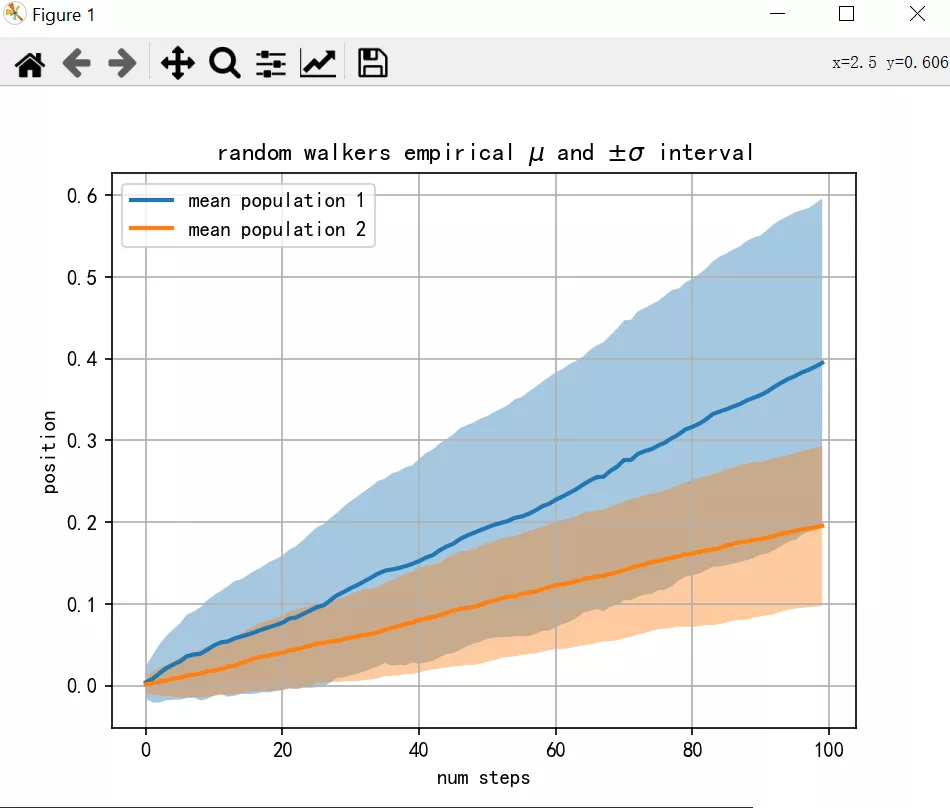
Define where to exclude certain horizontal areas to fill . The filled area consists of coordinates x[ among ] Definition . More precisely , If one [i] And [i+1], It's in x[i] and x[i+1] Fill between . Please note that , This definition means where Isolated true values between two false values in do not result in padding . Due to adjacent false values , Both sides of the real position remain unfilled .
import numpy as npimport matplotlib.pyplot as pltfig, ax = plt.subplots()x = np.arange(0, 4 * np.pi, 0.01)y = np.sin(x)ax.plot(x, y, color='black')ax.fill_between(x, y, 0, where=(x>4)&(x<5),color='cyan', alpha=0.5)plt.show()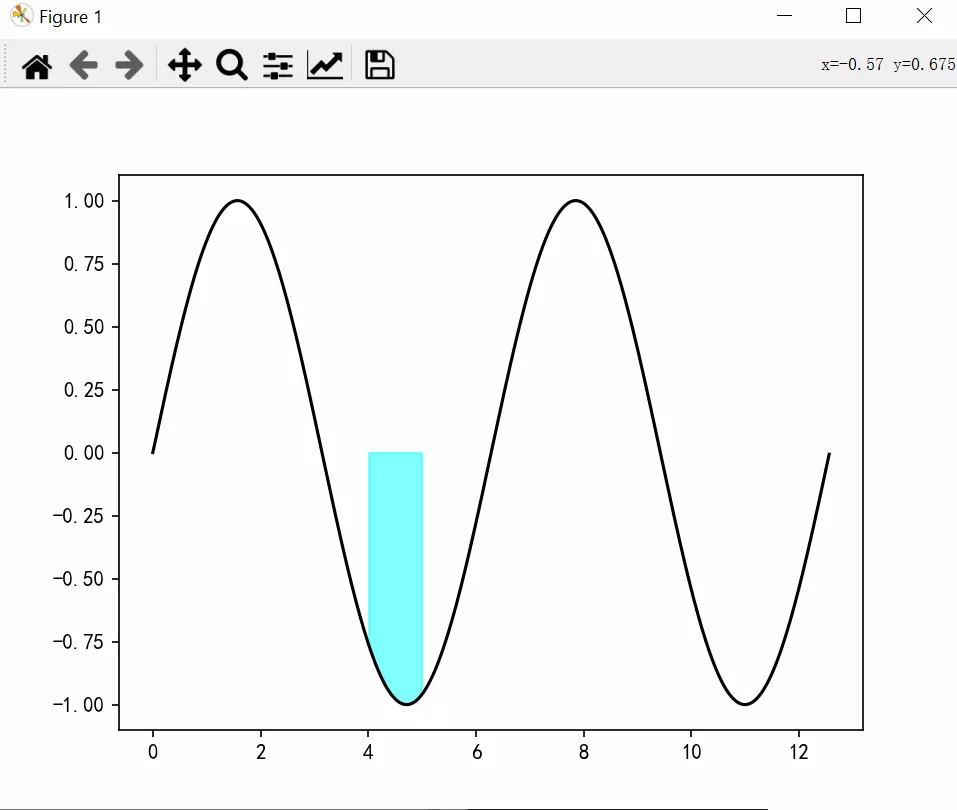
Semantically ,where Usually used for y1>y2 Or similar words . By default , Polygon nodes that define the filled area will be placed only on the x Position in the array . Such a polygon cannot describe the above semantics close to the intersection . Including intersections x The section is clipped only .
take “ interpolation ” Set to True The actual intersection will be calculated , And extend the filled area to this point .
import numpy as npimport matplotlib.pyplot as pltx = np.array([0, 1, 2, 3])y1 = np.array([0.8, 0.8, 0.2, 0.2])y2 = np.array([0, 0, 1, 1])fig, (ax1, ax2) = plt.subplots(2, 1, sharex=True)ax1.set_title('interpolation=False')ax1.plot(x, y1, 'o--')ax1.plot(x, y2, 'o--')ax1.fill_between(x, y1, y2, where=(y1 > y2), color='C0', alpha=0.3)ax1.fill_between(x, y1, y2, where=(y1 < y2), color='C1', alpha=0.3)ax2.set_title('interpolation=True')ax2.plot(x, y1, 'o--')ax2.plot(x, y2, 'o--')ax2.fill_between(x, y1, y2, where=(y1 > y2), color='C0', alpha=0.3, interpolate=True)ax2.fill_between(x, y1, y2, where=(y1 <= y2), color='C1', alpha=0.3, interpolate=True)fig.tight_layout()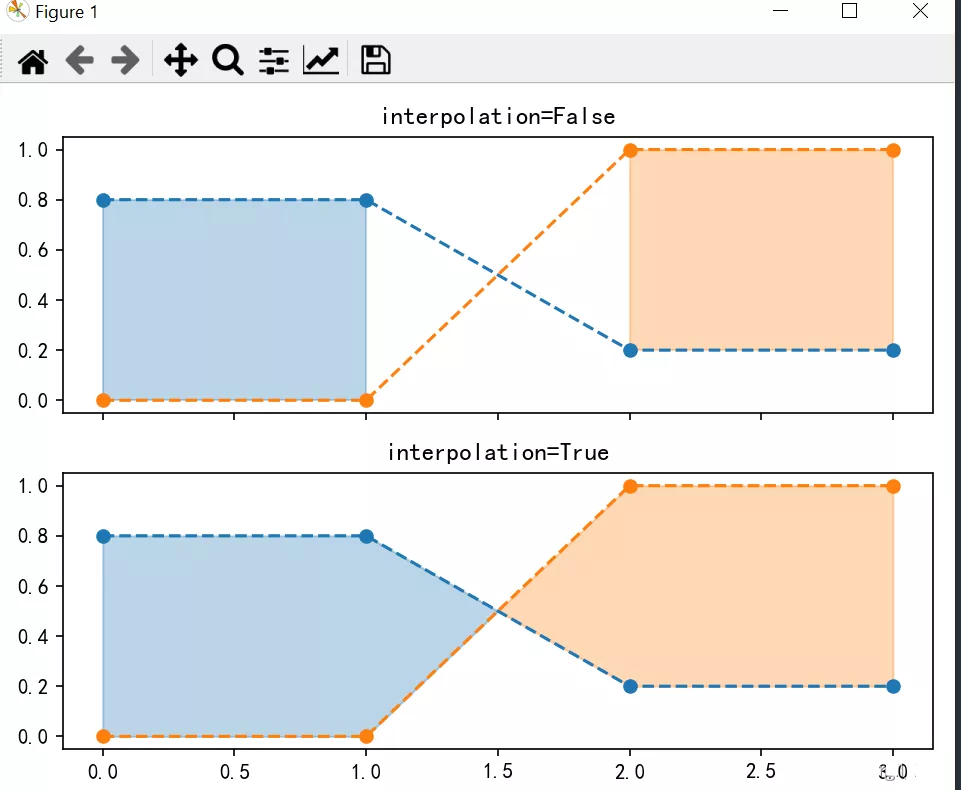
Contains three parameters {‘pre’,‘post’,‘mid’}
If filling should be a step function , namely x Constant between , Then define the step . This value determines where the step occurs :
“pre”:y Values from each x The position continues to the left , That's the interval (x[i-1],x[i]] The value of is y[i].
“post”:y Values from each x The position continues to the right , That's the interval [x[i],x[i+1]) The value of is y[i].
“mid”: The number of steps appears in x In the middle of the position .
import numpy as npimport matplotlib.pyplot as plta = np.linspace(0,2*3.14,50) b = np.sin(a) plt.figsize=((12,6))plt.subplot(131)plt.fill_between(a, b, 0, where = (a > 2) & (a < 5), color = 'green', step='pre') plt.plot(a,b)plt.title('step=pre')plt.subplot(132)plt.fill_between(a, b, 0, where = (a > 2) & (a < 5), color = 'cyan', step='post') plt.plot(a,b)plt.title('step=post')plt.subplot(133)plt.fill_between(a, b, 0, where = (a > 2) & (a < 5), color = 'red', step='mid') plt.plot(a,b)plt.title('step=mid')plt.show()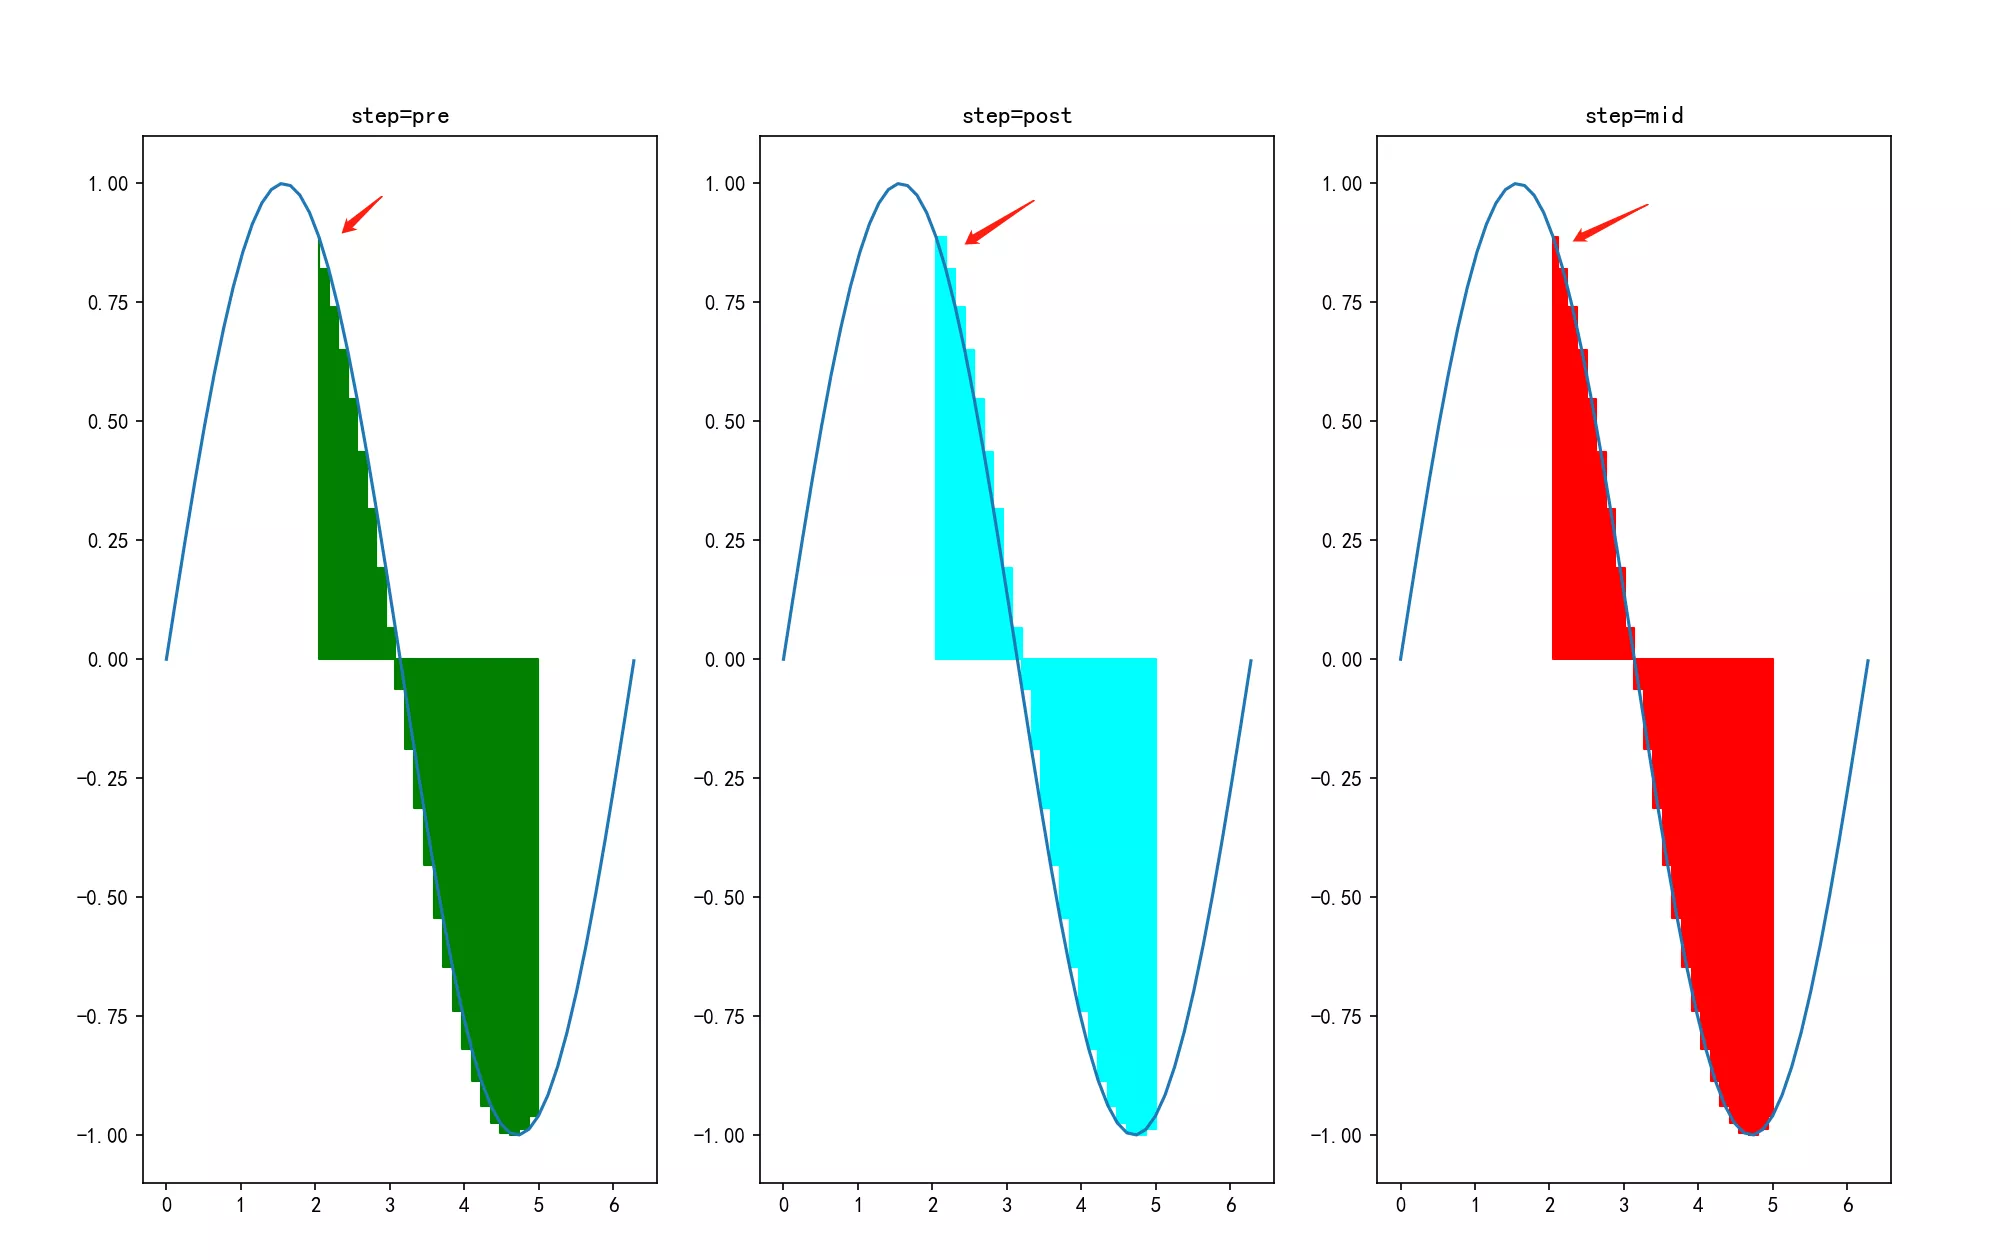
The offset will be a little different , Because of the function , The offset is not obvious
This is about python This is the end of the article on the filling of area graphs and curves , More about python For curve filling content, please search the previous articles of software development network or continue to browse the relevant articles below. I hope you can support software development network more in the future !