6 Month is graduation season , College entrance examination students are preparing to fill in the volunteers . This article uses Python It shows the distribution of colleges and universities across the country , There are many colleges and universities in China , Which places are less , You can see at a glance .
Data acquisition
To show the distribution of colleges and universities , You have to get the location data of colleges and universities nationwide first . The data of this article comes from the handheld college entrance examination network (https://www.gaokao.cn/school/search).
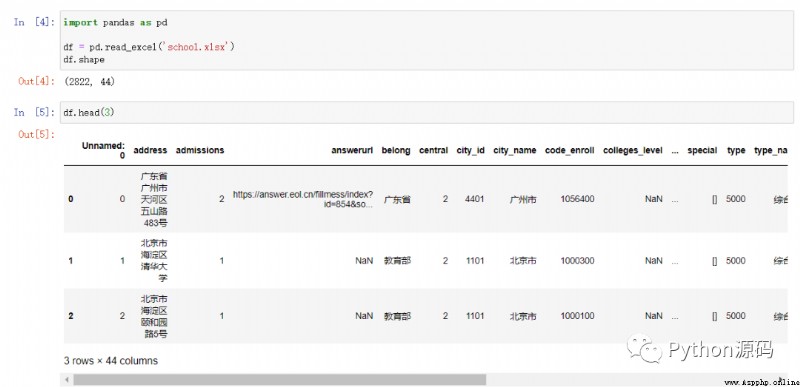
stay 2022 year 6 When writing this article last month , A total of 2822 Information about colleges and universities . Checked the data , Except for a few null values , The whole data is very complete , Not affecting use . The data is 44 A field , This article will only use a few fields , You can do nothing about it , When using, you can get it on demand .
Introduction to data acquisition methods ( Basic reptile knowledge ):
1. Register and log in to the handheld college entrance examination website . stay < Check the school > Select all schools on the page .
2. Press F12 key , Click to Network > Fetch/XHR, And then click a few times < Check the school > Page < The previous page >、< The next page > Button , stay XHR The page of will show the visited API Etc .
3. Turn the page every time API Copy it out for comparison , It is found that there are two parameters that change when turning pages :page and signsafe,page Is the number of pages currently accessed ,signsafe It's a md5 value , There is no reverse solution , But you can save the previous values , Later random change use . With this information , Constantly changing the number of pages visited and signsafe value , You can get all the school data .
Response Medium numFound The parameter value is the total number of schools , Divide by the number of schools displayed on each page to get the total number of pages , You can also directly click on the page < Tail page > View total pages , This determines the number of visits .
4. Because the website needs to be logged in to use , So we need to get the information of the access Headers, Such as Request Method( This time POST)、User-Agent etc. .
5. With the information above , Loop and splice all pages url, use requests Send a request to get the data of all colleges and universities , And then use pandas Write data to excel in .
reminder : Access to data is subject to the relevant statements of the website , Try to set a certain time interval for the crawler code , Do not run crawler code during peak access periods .
Additional explanation :
People's daily. Com recently announced : The number of colleges and universities in China is 2759 the , And this article obtained from the handheld college entrance examination network 2822 Difference 63 the , It is mainly the difference caused by different statistical methods of branch schools of some schools . This article shows the distribution , The difference has little effect .

Latitude and longitude acquisition
The handhold college entrance examination website is a website that provides volunteer services for college entrance examination , Although the data obtained are 44 A field , But there is no longitude and latitude of the school . In order to better display the location of colleges and universities on the map , You need to obtain the corresponding longitude and latitude according to the address of the school .
This article uses Baidu map open platform :
https://lbsyun.baidu.com/apiconsole/center#/home, You can use the open interface of Baidu map to obtain the longitude and latitude of the geographical location .
The procedure is :
1. Register and log in baidu account , This account can be a common account for the whole Baidu ecosystem ( Such as network disk 、 The account number of the library is universal ).
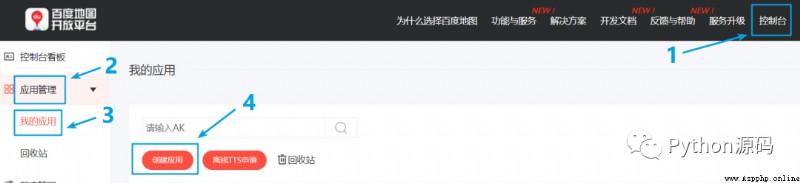
2. Log in to Baidu map open platform , Click to enter < Console >, And then in < Application management > Click on the < My application >, Click again < Create an > Create an application . Apply name customization , Other information shall be completed according to the prompts and requirements , And real name authentication , Become an individual developer .
3. After creating the app , Will get an application < To access the application (AK)>, Use this AK Value can call Baidu's API, The reference codes are as follows .
import requests
def baidu_api(addr):
url = "http://api.map.baidu.com/geocoding/v3/?"
params = {
"address": addr,
"output": "json",
"ak": " Copy the app you created AK Here we are "
}
req = requests.get(url, params)
res = req.json()
if len(res["result"]) > 0:
loc = res["result"]["location"]
return loc
else:
print(" obtain {} Longitude and latitude failed ".format(addr))
return {'lng': '', 'lat': ''}
4. Successfully called Baidu map API after , Read the location of all colleges , Call the above functions in turn , Get the longitude and latitude of all colleges , To write excel in .
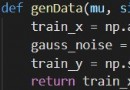
import pandas as pd
import numpy as np
def get_lng_lat():
df = pd.read_excel('school.xlsx')
lng_lat = []
for row_index, row_data in df.iterrows():
addr = row_data['address']
if addr is np.nan:
addr = row_data['city_name'] + row_data['county_name']
# print(addr)
loc = baidu_api(addr.split(',')[0])
lng_lat.append(loc)
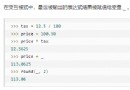
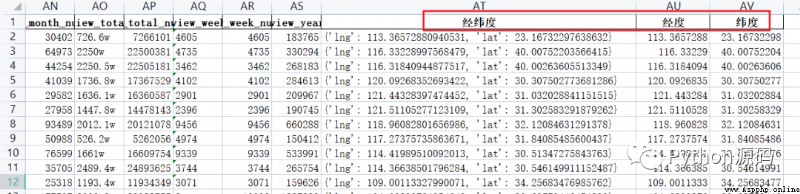
df[' Longitude and latitude '] = lng_lat
df[' longitude '] = df[' Longitude and latitude '].apply(lambda x: x['lng'])
df[' latitude '] = df[' Longitude and latitude '].apply(lambda x: x['lat'])
df.to_excel('school_lng_lat.xlsx')The final data results are shown in the figure below :
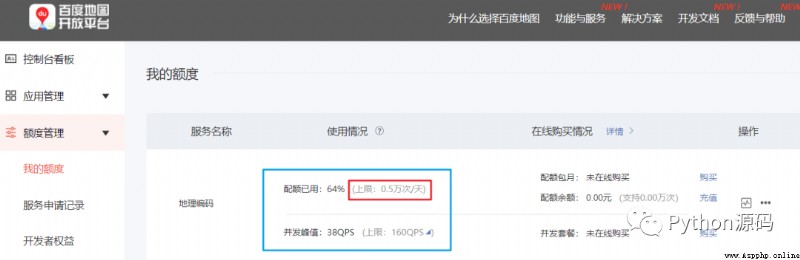
Individual developers should pay attention to when using Baidu map open platform , There is a daily limit , So don't use all the data when debugging the code , First use demo Run through , Otherwise, you have to wait one day or buy the quota .
The data is ready , Then show them on the map .
This article uses Baidu open source data visualization tool Echarts,Echarts by Python Language provides pyecharts library , Easy to use .
Installation command :
pip install pyechartsMark the location of the University
from pyecharts.charts import Geo
from pyecharts import options as opts
from pyecharts.globals import GeoType
import pandas as pd
def multi_location_mark():
""" Mark points in batch """
geo = Geo(init_opts=opts.InitOpts(bg_color='black', width='1600px', height='900px'))
df = pd.read_excel('school_lng_lat.xlsx')
for row_index, row_data in df.iterrows():
geo.add_coordinate(row_data['name'], row_data[' longitude '], row_data[' latitude '])
data_pair = [(name, 2) for name in df['name']]
geo.add_schema(
maptype='china', is_roam=True, itemstyle_opts=opts.ItemStyleOpts(color='#323c48', border_color='#408080')
).add(
'', data_pair=data_pair, type_=GeoType.SCATTER, symbol='pin', symbol_size=16, color='#CC3300'
).set_series_opts(
label_opts=opts.LabelOpts(is_show=False)
).set_global_opts(
title_opts=opts.TitleOpts(title=' National University location map ', pos_left='650', pos_top='20',
title_textstyle_opts=opts.TextStyleOpts(color='white', font_size=16))
).render('high_school_mark.html')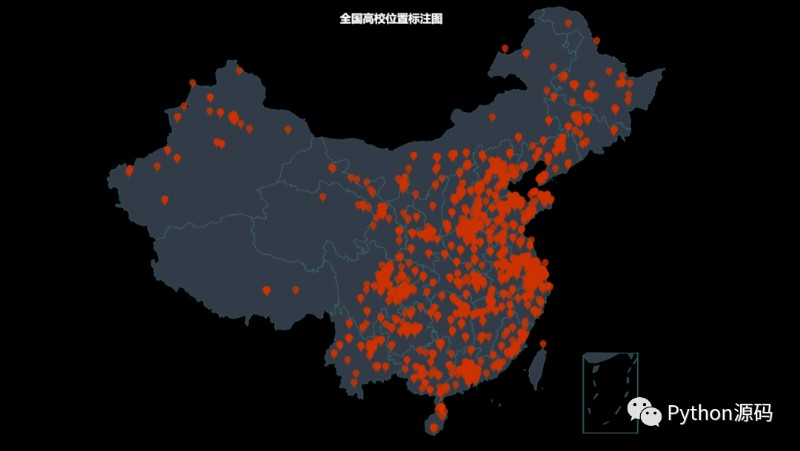
From the result of annotation , Colleges and universities are mainly distributed along the coast 、 Central and Eastern , In the west, especially in high altitude areas, the distribution is relatively small .
2. Draw the heat map of colleges and universities
from pyecharts.charts import Geo
from pyecharts import options as opts
from pyecharts.globals import ChartType
import pandas as pd
def draw_location_heatmap():
""" Draw a heat map """
geo = Geo(init_opts=opts.InitOpts(bg_color='black', width='1600px', height='900px'))
df = pd.read_excel('school_lng_lat.xlsx')
for row_index, row_data in df.iterrows():
geo.add_coordinate(row_data['name'], row_data[' longitude '], row_data[' latitude '])
data_pair = [(name, 2) for name in df['name']]
geo.add_schema(
maptype='china', is_roam=True, itemstyle_opts=opts.ItemStyleOpts(color='#323c48', border_color='#408080')
).add(
'', data_pair=data_pair, type_=ChartType.HEATMAP
).set_series_opts(
label_opts=opts.LabelOpts(is_show=False)
).set_global_opts(
title_opts=opts.TitleOpts(title=' Nationwide University distribution heat map ', pos_left='650', pos_top='20',
title_textstyle_opts=opts.TextStyleOpts(color='white', font_size=16)),
visualmap_opts=opts.VisualMapOpts()
).render('high_school_heatmap.html')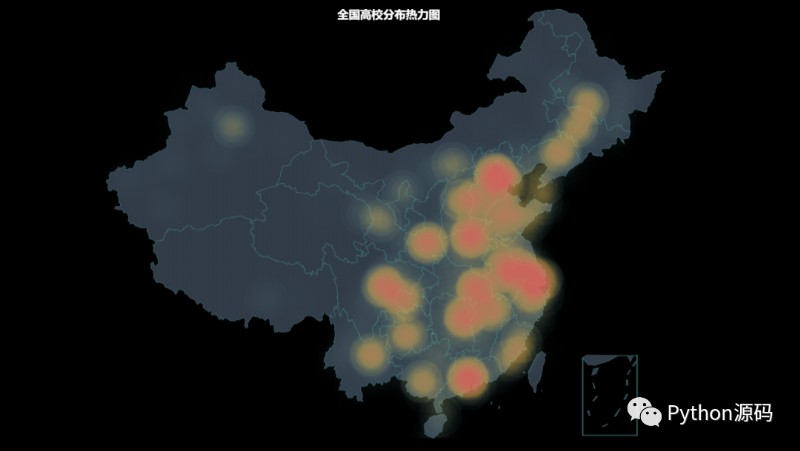
From the thermodynamic diagram , The places where colleges and universities are concentrated are mainly along the coast 、 Beishangguang 、 The Yangtze and yellow river basins , Sichuan and Chongqing are the only places in the West .
3. Draw the distribution density map by province
from pyecharts.charts import Map
from pyecharts import options as opts
import pandas as pd
def draw_location_density_map():
""" Draw the distribution density map of colleges and universities in each province """
map = Map(init_opts=opts.InitOpts(bg_color='black', width='1200px', height='700px'))
df = pd.read_excel('school_lng_lat.xlsx')
s = df['province_name'].value_counts()
data_pair = [[province, int(s[province])] for province in s.index]
map.add(
'', data_pair=data_pair, maptype="china"
).set_global_opts(
title_opts=opts.TitleOpts(title=' The distribution density of colleges and universities across the country by province ', pos_left='500', pos_top='70',
title_textstyle_opts=opts.TextStyleOpts(color='white', font_size=16)),
visualmap_opts=opts.VisualMapOpts(max_=200, is_piecewise=True, pos_left='100', pos_bottom='100', textstyle_opts=opts.TextStyleOpts(color='white', font_size=16))
).render("high_school_density.html")
It can be seen from the provincial distribution density map , The provinces with a large number of colleges and universities are concentrated in the central and eastern regions , Especially in the provinces near Beijing and Shanghai .
4.211 and 985 The distribution of colleges and universities
select 211 and 985 College data of , Draw again .( The code is not pasted repeatedly , Just add a line of filter code )
The above is the whole content of this paper , If you are interested in the above , You can try more . If you need source code, follow official account :Python Source code obtain