Preface :
The initial stage of data analysis , Usually, visual processing is required . Data visualization aims to visually display the analysis results and ideas of information , Visualize some abstract data , These abstract data include the nature or quantity of data measurement units . Libraries used in this chapter matplotlib It's based on Numpy The one above Python Gallery , It provides an object-oriented API And a procedural class MATLAB API, They can be used in parallel .
1、
import numpy as npimport matplotlib.pyplot as pltscores=np.random.randint(0,100,50)plt.hist(scores,bins=8,histtype=‘stepfilled')plt.title(‘37')plt.show()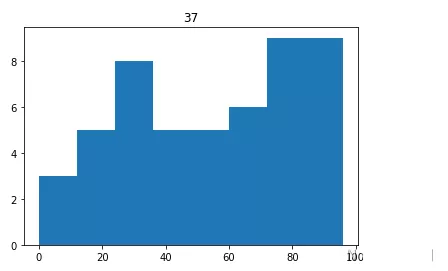
2、
x=np.arange(6)y1=np.array([1,4,3,5,6,7])y2=np.array([3,4,3,5,6,7])y3=np.array([2,4,3,5,6,7])plt.stackplot(x,y1,y2,y3)plt.title(‘37')plt.show()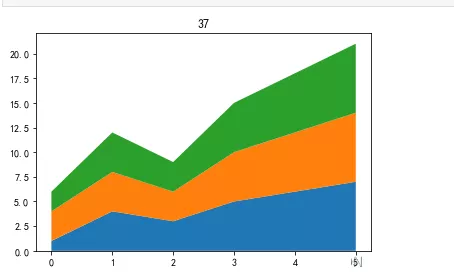
3、
random_state=np.random.RandomState(1231241)random_x=random_state.randn(10000)plt.hist(random_x,bins=25)plt.title(‘37')plt.show()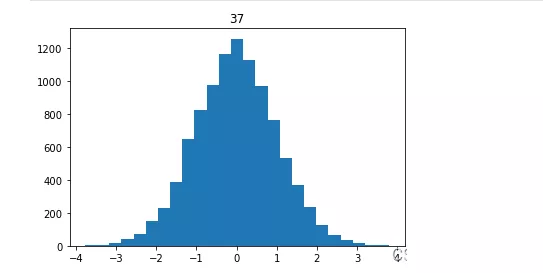
4、
data=np.array([10,30,15,30,15])pie_labels=np.array([‘A',‘B',‘C',‘D',‘E'])plt.pie(data,radius=1.5,labels=pie_labels,autopct='%3.1f%%')plt.title(‘37')plt.show()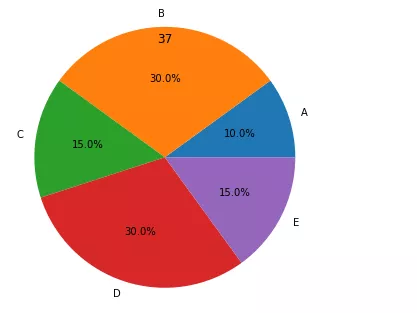
5、
import matplotlib as mplmpl.rcParams[‘font.sans-serif']=[‘SimHei']mpl.rcParams[‘axes.unicode_minus']=Falsekinds=[‘ shopping ',‘ In town ',‘ Food and drink ',‘ signal communication ',‘ Daily life ',‘ Transportation ',‘ Recreation & Entertainment ',‘ other ']money_scale=[500/1500,123/1500,400/1500,234/1500,300/1500,200/1500,100/1500,150/1500]dev_position=[0.1,0.1,0.1,0.1,0.1,0.1,0.1,0.1]plt.pie(money_scale,labels=kinds,autopct='%3.1f%%',shadow=True,explode=dev_position,startangle=90)plt.title(‘37')plt.show()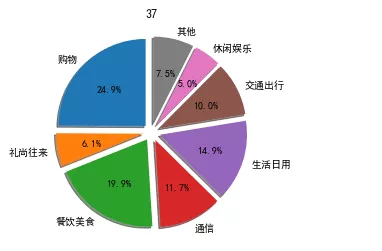
6、
num=50x=np.random.rand(num)y=np.random.rand(num)plt.scatter(x,y)plt.title(‘37')plt.show()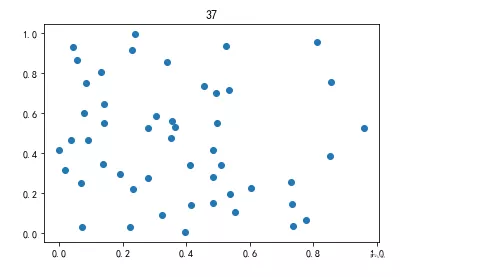
7、
num=50x=np.random.rand(num)y=np.random.rand(num)area=(800*np.random.rand(num)**2)plt.scatter(x,y,s=area)plt.title(‘37')plt.show()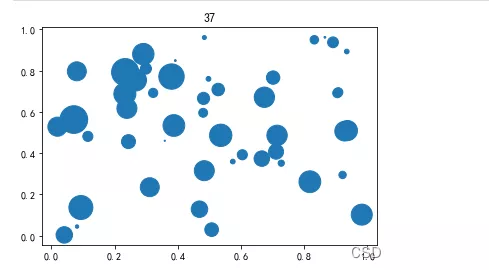
8、
plt.rcParams[‘font.sans-serif']=‘SimHei'plt.rcParams[‘axes.unicode_minus']=Falsex_speed=np.arange(10,210,10)y_distance=np.array([0.3,0.5,1,3,5,5.5,7,8,9,12,14,15.5,17.8,19,20,23,27,30,31,32])plt.scatter(x_speed,y_distance,s=50,alpha=0.9)plt.title(‘37')plt.show()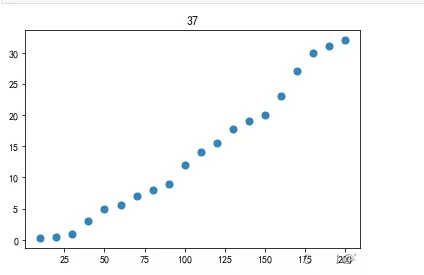
9、
plt.rcParams[‘font.family']= ‘SimHei'plt.rcParams[‘axes.unicode_minus']=Falsedata_2018=np.array([4500,6654.5,5283.4,5107.8,5443.3,5550.6,6400.2,6404.9,5483.1,5330.2,5543,6199.9])data_2017=np.array([4605.2,4710.3,5168.9,4767.2,4947,5203,6047.4,5945.5,5219.6,5038.1,5196.3,5698.6])plt.boxplot([data_2018,data_2017],labels=(‘2018 year ',‘2017 year '),meanline=True,widths=0.5,vert=False,patch_artist=True)plt.title(‘37')plt.show()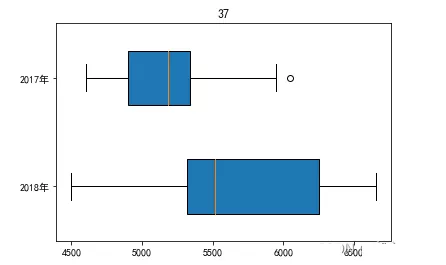
10、
plt.rcParams[‘font.family']= ‘SimHei'plt.rcParams[‘axes.unicode_minus']=Falsedim_num=6data=np.array([[0.50,0.32,0.35,0.30,0.30,0.88],[0.45,0.35,0.30,0.40,0.40,0.30],[0.43,0.99,0.30,0.28,0.22,0.30],[0.30,0.25,0.48,0.95,0.45,0.40],[0.20,0.38,0.87,0.45,0.32,0.28],[0.34,0.31,0.38,0.40,0.92,0.28]])angles=np.linspace(0, 2 * np.pi, dim_num, endpoint=False)angles=np.concatenate((angles,[angles[0]]))data=np.concatenate((data,[data[0]]))radar_labels=[‘ Research type (I)',‘ Artistic type (A)',‘ Social type (S)',‘ Enterprise type (E)',‘ Traditional type ',‘ Realistic ']radar_labels=np.concatenate((radar_labels, [radar_labels[0]]))plt.polar(angles, data)plt.thetagrids(angles * 180/np.pi, labels=radar_labels)plt.fill(angles, data, alpha=0.25)plt.title(‘37')plt.show()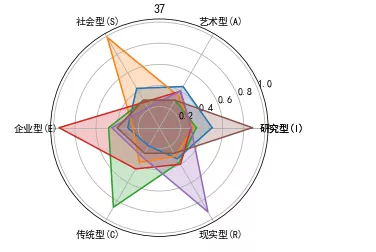
11、
data =np.array([20,50,10,15,30,55])pie_labels=np.array([‘A',‘B',‘C',‘D',‘E',‘F'])plt.pie(data,radius=1.5,wedgeprops={‘width': 0.7},labels=pie_labels,autopct='%3.1f%%',pctdistance=0.75)plt.title(‘37')plt.show()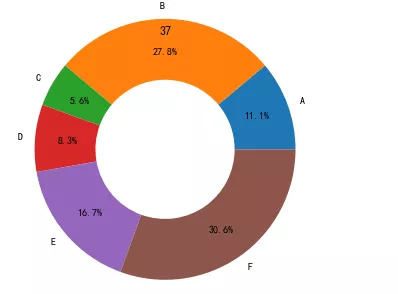
12、
x = np.arange(1,13)y_a = np.array([191,123,234,42,123,432,567,234,231,132,123,134])y_b = np.array([123,143,234,242,523,232,467,334,131,332,234,345])y_c = np.array([91,123,534,432,223,332,367,434,111,322,345,560])plt.stackplot(x,y_a,y_b,y_c)plt.title(‘37')plt.show()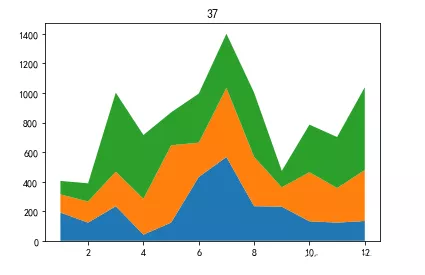
This is about python This is the end of the article on data analysis and drawing visualization , More about python For visual content, please search the previous articles of SDN or continue to browse the relevant articles below. I hope you will support SDN more in the future !