In the past , The English word for business analysis is Business Analysis, The analysis tool we use is Excel, Later, there was a large amount of data ,Excel I can't cope with it (Excel The maximum number of rows supported is 1048576 That's ok ), People began to turn python and R Such an analysis tool , At this time, the corresponding word of business analysis is Business Analytics.
Actually python and Excel The same rules as , All are [We don't repeat ourselves], It is to replace mechanical operation and pure physical labor with more convenient operation as far as possible .
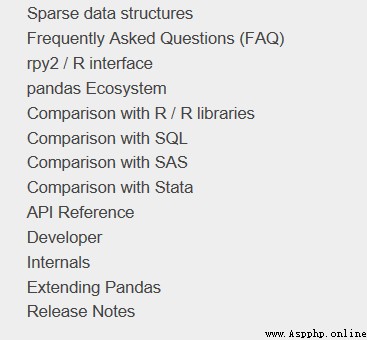
use python Do data analysis , Can not do without the famous pandas package , After many versions of iterative optimization ,pandas Now the ecosystem is quite complete , The official website also gives a comparison with other analysis tools :
This article mainly uses pandas, The library for drawing is plotly, Realized Excel The common functions of are :
Python and Excel Interaction
vlookup function
PivotTable
mapping
If more are discovered in the future Excel The function of , Will come back and continue to update and supplement . Before the start , First, load according to the Convention pandas package :
import numpy as npimport pandas as pdpd.set_option('max_columns', 10)pd.set_option('max_rows', 20)pd.set_option('display.float_format', lambda x: '%.2f' % x) # Prohibition of scientific counting
Python and Excel Interaction
pandas The most commonly used and Excel I/O The four functions concerned are read_csv/ read_excel/ to_csv/ to_excel, They all have specific parameter settings , You can customize the desired read and export effects .
For example, you want to read the upper left part of such a table :
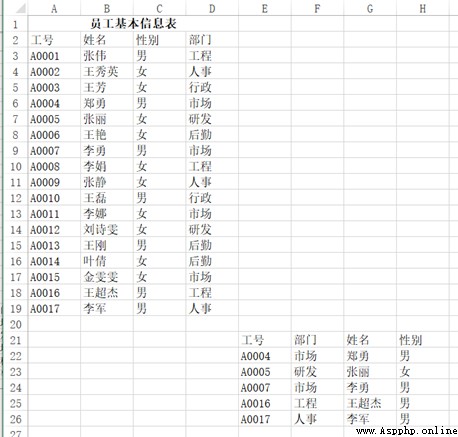
It can be used pd.read_excel("test.xlsx", header=1, nrows=17, usecols=3), Return results :
dfOut[]:Job number full name Gender department0 A0001 Zhang Wei male engineering1 A0002 Wang Xiuying Woman Personnel matters2 A0003 Wang Fang Woman Administration3 A0004 Zheng Yong male market4 A0005 Zhang Li Woman Research and development5 A0006 Wang Yan Woman logistics6 A0007 Li Yong male market7 A0008 Li Juan Woman engineering8 A0009 Zhang Jing Woman Personnel matters9 A0010 Wang lei male Administration10 A0011 Li na Woman market11 A0012 Liu shiwen Woman Research and development12 A0013 Wang Gang male logistics13 A0014 Yeqian Woman logistics14 A0015 Jin Wenwen Woman market15 A0016 Wang Chaojie male engineering16 A0017 Li Jun male Personnel matters
The same goes for output functions , How many columns are used , Do you want it or not? index, How to put the title , Can be controlled .
vlookup function
vlookup Claims to be Excel One of the artifacts in , Very versatile , The following example is from Douban ,VLOOKUP Functions are most commonly used 10 Usage , How many kinds do you know ?
Case a
problem :A3:B7 The cell range is an alphabetic rank query table , Express 60 It is divided into the following E level 、60~69 It is divided into D level 、70~79 It is divided into C level 、80~89 It is divided into B level 、90 The above points are A level .D:G As grade two of junior high school 1 Class Chinese test result sheet , How to return the letter grade according to the Chinese score ?
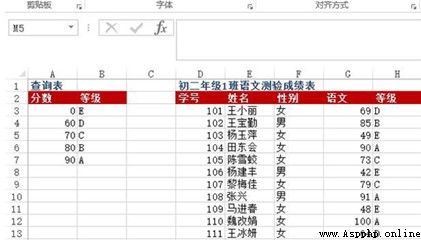
Method : stay H3:H13 Enter... In the cell range =VLOOKUP(G3, $A$3:$B$7, 2)
python Realization :
df = pd.read_excel("test.xlsx", sheet_name=0)def grade_to_point(x):if x >= 90:return 'A'elif x >= 80:return 'B'elif x >= 70:return 'C'elif x >= 60:return 'D'else:return 'E'df[' Grade '] = df[' Chinese language and literature '].apply(grade_to_point)dfOut[]:Student number full name Gender Chinese language and literature Grade0 101 Wang Xiaoli Woman 69 D1 102 Wangbaoqin male 85 B2 103 Yang Yuping Woman 49 E3 104 Tiandong will Woman 90 A4 105 Chenxuejiao Woman 73 C5 106 Yangjianfeng male 42 E6 107 Li Meijia Woman 79 C7 108 Zhang Xing male 91 A8 109 Majinchun Woman 48 E9 110 Weigaijuan Woman 100 A10 111 Wangbingyan Woman 64 D
Case 2
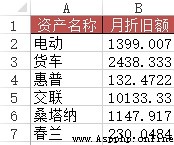
problem : stay Sheet1 How to find the monthly depreciation amount under the corresponding number in the depreciation details ?( Across the table to query )
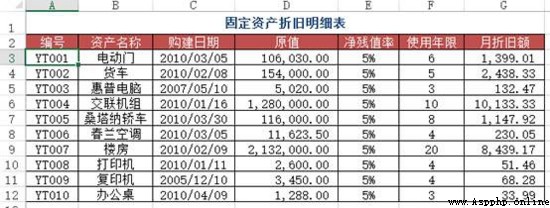
Method : stay Sheet1 Inside C2:C4 Cell input =VLOOKUP(A2, Depreciation schedule !A$2:$G$12, 7, 0)
python Realization : Use merge Just connect the two tables by number
df1 = pd.read_excel("test.xlsx", sheet_name=' Depreciation schedule ')df2 = pd.read_excel("test.xlsx", sheet_name=1) # In the title sheet1df2.merge(df1[[' Number ', ' Monthly depreciation ']], how='left', on=' Number ')Out[]:Number Asset name Monthly depreciation0 YT001 Electrically operated gate 13991 YT005 Santana car 11472 YT008 The printer 51
Case three
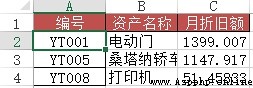
problem : Similar to case 2 , But in this case, you need to use approximate search
Method : stay B2:B7 Enter the formula... In the field =VLOOKUP(A2&"*", Depreciation schedule !$B$2:$G$12, 6, 0)
python Realization : This one is more troublesome than the last one , Need to use some pandas Use skills
df1 = pd.read_excel("test.xlsx", sheet_name=' Depreciation schedule ')df3 = pd.read_excel("test.xlsx", sheet_name=3) # A table containing abbreviated asset namesdf3[' Monthly depreciation '] = 0for i in range(len(df3[' Asset name '])):df3[' Monthly depreciation '][i] = df1[df1[' Asset name '].map(lambda x:df3[' Asset name '][i] in x)][' Monthly depreciation ']df3Out[]:Asset name Monthly depreciation0 electric 13991 truck 24382 HP 1323 Crosslink 101334 santana 11475 cymbidium 230
Case four
problem : stay Excel When entering data information in , In order to improve work efficiency , The user wants to enter the keyword of the data , Automatically display the remaining information of the record , for example , Enter the employee's job number and the employee's trust will be displayed automatically , Enter the material number and the product name of the material will be displayed automatically 、 Unit price, etc .
As shown in the figure, it is the data source table of basic information of all employees in a company , stay “2010 year 3 Monthly employee leave statistics ” In the worksheet , When in A When the employee job number is entered in the column , How to implement the corresponding employee name 、 ID number 、 department 、 position 、 Automatic entry of employment date and other information ?
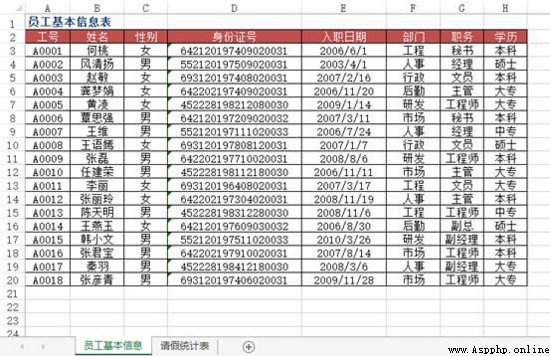
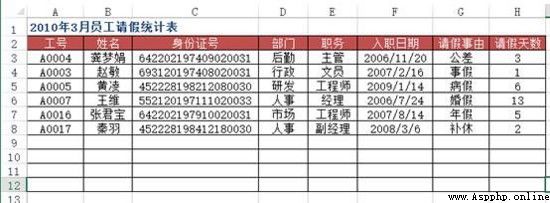
Method : Use VLOOKUP+MATCH function , stay “2010 year 3 Monthly employee leave statistics ” Select... From the worksheet B3:F8 Cell range , Enter the following formula =IF($A3="","",VLOOKUP($A3, Basic employee information !$A:$H,MATCH(B$2, Basic employee information !$2:$2,0),0)), Press down 【Ctrl+Enter】 End of key combination .
python Realization : above Excel The method is flexible , however pandas The idea and operation are simpler and more convenient
df4 = pd.read_excel("test.xlsx", sheet_name=' Employee basic information table ')df5 = pd.read_excel("test.xlsx", sheet_name=' Leave statistics ')df5.merge(df4[[' Job number ', ' full name ', ' department ', ' position ', ' Date of entry ']], on=' Job number ')Out[]:Job number full name department position Date of entry0 A0004 Gongmengjuan logistics executive director 2006-11-201 A0003 Zhao Min Administration Clerk 2007-02-162 A0005 Huangling Research and development The engineer 2009-01-143 A0007 Wang wei Personnel matters The manager 2006-07-244 A0016 Zhang Junbao market The engineer 2007-08-145 A0017 Qin Yu Personnel matters Deputy Manager 2008-03-06
Case 5
problem : use VLOOKUP Function to realize batch search ,VLOOKUP Function can only find one in general , So how to find multiple items ? Here's the picture , How to list all the consumption of Zhang Yi ?
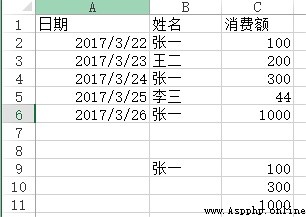
Method : stay C9:C11 Enter the formula in the cell =VLOOKUP(B$9&ROW(A1),IF({1,0},$B$2:$B$6&COUNTIF(INDIRECT("b2:b"&ROW($2:$6)),B$9),$C$2:$C$6),2,) , Press SHIFT+CTRL+ENTER Key end .
python Realization :vlookup Function has two disadvantages ( Maybe it's a feature ), One is that the value to be searched must be in the first column of the field , The other is that you can only find one value , The rest will not be searched even if they can match , These two points can be flexibly applied if and indirect Function to solve , however pandas Can be more straightforward .
df6 = pd.read_excel("test.xlsx", sheet_name=' Consumption ')df6[df6[' full name '] == ' Zhang Yi '][[' full name ', ' Consumption ']]Out[]:full name Consumption0 Zhang Yi 1002 Zhang Yi 3004 Zhang Yi 1000
PivotTable
The PivotTable is Excel Another artifact of , In essence, it is a process of table reorganization and integration . The case used here comes from Zhihu ,Excel What is the use of PivotTables :( https://www.zhihu.com/question/22484899/answer/39933218 )
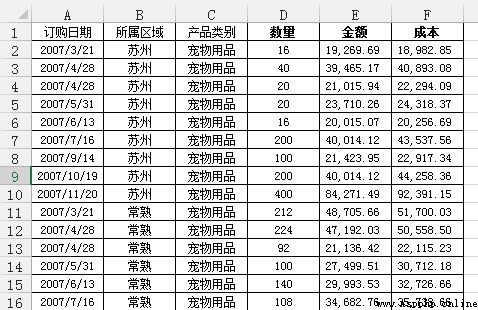
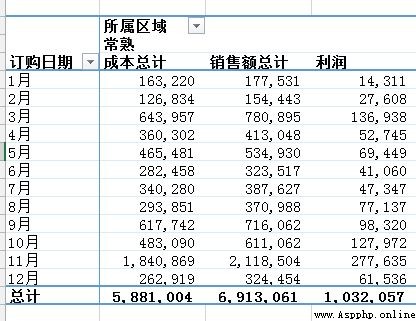
problem : Each area needs to be summarized , Total sales and costs per month , And calculate the profit at the same time
adopt Excel The PivotTable operation of the has finally achieved the following effects :
python Realization : For such grouped tasks , The first thing that comes to mind pandas Of groupby, The code is also simple to write , The train of thought is to put just Excel The click of the mouse is reflected in the code command :
df = pd.read_excel('test.xlsx', sheet_name=' Sales statistics ')df[' Order month '] = df[' subscription date '].apply(lambda x:x.month)df2 = df.groupby([' Order month ', ' Area '])[[' sales ', ' cost ']].agg('sum')df2[' profits '] = df2[' sales '] - df2[' cost ']df2Out[]:sales cost profitsOrder month Area1 nanjing 134313.61 94967.84 39345.77Changshu 177531.47 163220.07 14311.40wuxi 316418.09 231822.28 84595.81Kunshan 159183.35 145403.32 13780.03Suzhou 287253.99 238812.03 48441.962 nanjing 187129.13 138530.42 48598.71Changshu 154442.74 126834.37 27608.37wuxi 464012.20 376134.98 87877.22Kunshan 102324.46 86244.52 16079.94Suzhou 105940.34 91419.54 14520.80... ... ...11 nanjing 286329.88 221687.11 64642.77Changshu 2118503.54 1840868.53 277635.01wuxi 633915.41 536866.77 97048.64Kunshan 351023.24 342420.18 8603.06Suzhou 1269351.39 1144809.83 124541.5612 nanjing 894522.06 808959.32 85562.74Changshu 324454.49 262918.81 61535.68wuxi 1040127.19 856816.72 183310.48Kunshan 1096212.75 951652.87 144559.87Suzhou 347939.30 302154.25 45785.05[60 rows x 3 columns]
You can also use pandas Inside pivot_table Function to implement :
df3 = pd.pivot_table(df, values=[' sales ', ' cost '], index=[' Order month ', ' Area '] , aggfunc='sum')df3[' profits '] = df3[' sales '] - df3[' cost ']df3Out[]:cost sales profitsOrder month Area1 nanjing 94967.84 134313.61 39345.77Changshu 163220.07 177531.47 14311.40wuxi 231822.28 316418.09 84595.81Kunshan 145403.32 159183.35 13780.03Suzhou 238812.03 287253.99 48441.962 nanjing 138530.42 187129.13 48598.71Changshu 126834.37 154442.74 27608.37wuxi 376134.98 464012.20 87877.22Kunshan 86244.52 102324.46 16079.94Suzhou 91419.54 105940.34 14520.80... ... ...11 nanjing 221687.11 286329.88 64642.77Changshu 1840868.53 2118503.54 277635.01wuxi 536866.77 633915.41 97048.64Kunshan 342420.18 351023.24 8603.06Suzhou 1144809.83 1269351.39 124541.5612 nanjing 808959.32 894522.06 85562.74Changshu 262918.81 324454.49 61535.68wuxi 856816.72 1040127.19 183310.48Kunshan 951652.87 1096212.75 144559.87Suzhou 302154.25 347939.30 45785.05[60 rows x 3 columns]
pandas Of pivot_table Parameters of index/ columns/ values and Excel The parameters in are corresponding to ( Of course , I didn't say that , There are rows in the PivotTable / Column / Is it worth it? What else .)

But I personally prefer to use groupby, Because it is very fast . I'm playing kaggle During the game , There is a table showing the behavior information of the lender , There are about 2700 Line ten thousand , use groupby Calculated several aggregate functions , It's done in a few seconds .
groupby It's very versatile , Built in a lot aggregate function , It can meet most basic needs , If you need some other functions , Can be used in combination apply and lambda.
however pandas The official documents of say ,groupby After use apply Very slow ,aggregate Internal optimization , So soon ,apply There is no optimization , So it is suggested to think of other methods first if there is a problem , Use it when you really can't apply.
When I was playing , To generate a new variable , It was used groupby Of apply, Wrote such a sentence : ins['weight'] = ins[['SK_ID_PREV' , 'DAYS_ENTRY_PAYMENT']].groupby('SK_ID_PREV').apply(lambda x: 1-abs(x)/x.sum().abs()).iloc[:,1] ,1000 Ten thousand lines of data , For more than ten minutes , I am exhausted by waiting .
mapping
because Excel The drawing can interact with each other , Be able to perform some simple operations on the diagram , So it's used here python The visualization library for is plotly, Let's use my homework in development economics this semester , At that time, all the drawings were made with Excel Painted , Now use python Draw again . Before the start , First load plotly package .
import plotly.offline as offimport plotly.graph_objs as gooff.init_notebook_mode()
Histogram
Then used Excel I drew a lot of bar charts , One of the pictures is
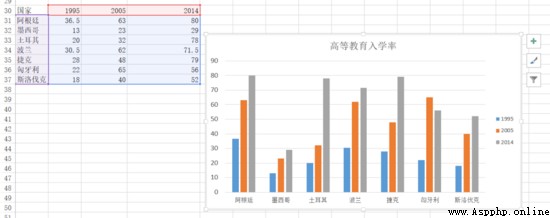
The following is used plotly Let's draw
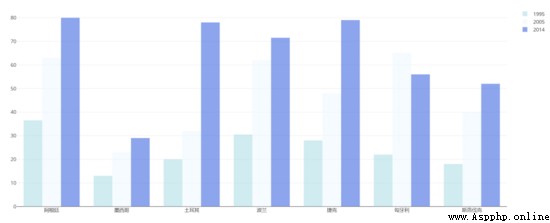
df = pd.read_excel("plot.xlsx", sheet_name=' Enrolment in Higher Education ')trace1 = go.Bar(x=df[' Country '],y=df[1995],name='1995',opacity=0.6,marker=dict(color='powderblue'))trace2 = go.Bar(x=df[' Country '],y=df[2005],name='2005',opacity=0.6,marker=dict(color='aliceblue',))trace3 = go.Bar(x=df[' Country '],y=df[2014],name='2014',opacity=0.6,marker=dict(color='royalblue'))layout = go.Layout(barmode='group')data = [trace1, trace2, trace3]fig = go.Figure(data, layout)off.plot(fig)
Radar map
use Excel Painted :
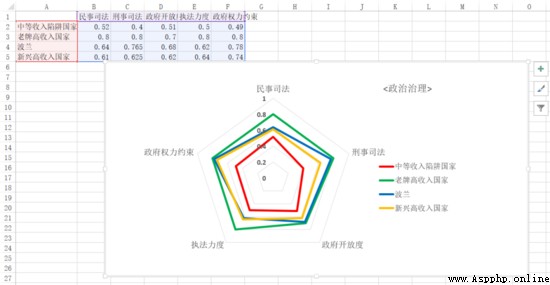
use python Painted :

df = pd.read_excel('plot.xlsx', sheet_name=' Political governance ')theta = df.columns.tolist()theta.append(theta[0])names = df.indexdf[''] = df.iloc[:,0]df = np.array(df)trace1 = go.Scatterpolar(r=df[0],theta=theta,name=names[0])trace2 = go.Scatterpolar(r=df[1],theta=theta,name=names[1])trace3 = go.Scatterpolar(r=df[2],theta=theta,name=names[2])trace4 = go.Scatterpolar(r=df[3],theta=theta,name=names[3])data = [trace1, trace2, trace3, trace4]layout = go.Layout(polar=dict(radialaxis=dict(visible=True,range=[0,1])),showlegend=True)fig = go.Figure(data, layout)off.plot(fig)
It is better than Excel It's much more troublesome .
Overall speaking , If you draw simple basic figures , use Excel It's the most convenient , If you want to draw more advanced or more customized graphics , Use python More appropriate .