Preface
Examples of use
plt.contour() The function itself
plt.contour() Coordinates in the diagram
Add :plt.contour Contour drawing
summary
Prefaceplt.contour yes python Functions used to draw contour lines in , Here is an introduction plt.contour Use .
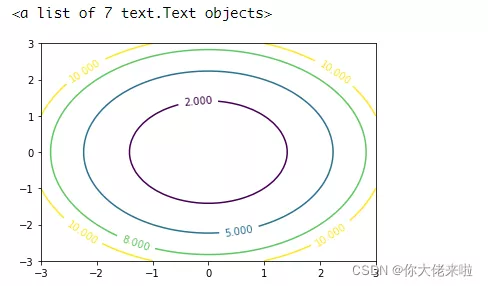
Examples of useimport numpy as npimport matplotlib.pyplot as pltx = np.linspace(-3, 3, 50) # Generate continuous data y = np.linspace(-3, 3, 50) # Generate continuous data X, Y = np.meshgrid(x, y) # Generate an array that can form a lattice in a coordinate system , You can refer to other articles for this # https://lixiaoqian.blog.csdn.net/article/details/81532855 It's more detailed here Z = X**2 + Y**2 # Here the height is set to x^2+y^2, You can draw a circular contour line C=plt.contour(x, y,Z,[2,5,8,10]) # Draw contour lines # Use plt.contour(X, Y,Z,[2,5,8,10]) No problem plt.clabel(C, inline=True, fontsize=10)The result is :
plt.contour(X, Y, Z, [levels], **kwargs)
plt Namely matplotlib.pyplot
X, Y It represents the coordinate position ( Here is optional , But if it doesn't pass in, it's python According to the passed in height array (Z) The size of the automatically generated coordinates ), Most people use two-dimensional arrays , But in fact, one-dimensional arrays can also be used
Z Represents the height value corresponding to each coordinate , Is a two-dimensional array , Where each value represents the height corresponding to each coordinate XYZ The actual data structure of can refer to the above example , Check what the data looks like locally
levels There are two forms of afferent . One is to pass in an integer , This integer represents the number of contour lines you want to plot , However, the display result may not be exactly the same as the number of integers passed in , It's about the same number ( There may be oneortwo differences )( Why is the approximate number ? May be python Help you generate some suitable contour lines by default ). Another way is to pass in a one-dimensional array containing height values , such python The contour line corresponding to the incoming height value will be drawn .
Remaining parameters cmap, linewidths, linestyles There will be no more introduction here
plt.contour() Coordinates in the diagramBecause it was confusing at first , So here is an explanation of what coordinates represent . Explain the problem , First, we can introduce practical problems , Like a mountain , Generally speaking, if you look at the mountain from the plane or from a very high place, you can see that the mountain is like a circle , If it is abstracted into a plane, it will become a circle ( This refers to a relatively orderly mountain ). Then in fact, the contour line is imagined from such a high place , Mark the position of the same height on a plane through a series of tools , The same height positions are connected by lines to form contour lines .
If you put the circle just mentioned in the coordinate system , So a certain coordinate (x,y) It means the position of the observed mountain in the plane view , Here's the picture :
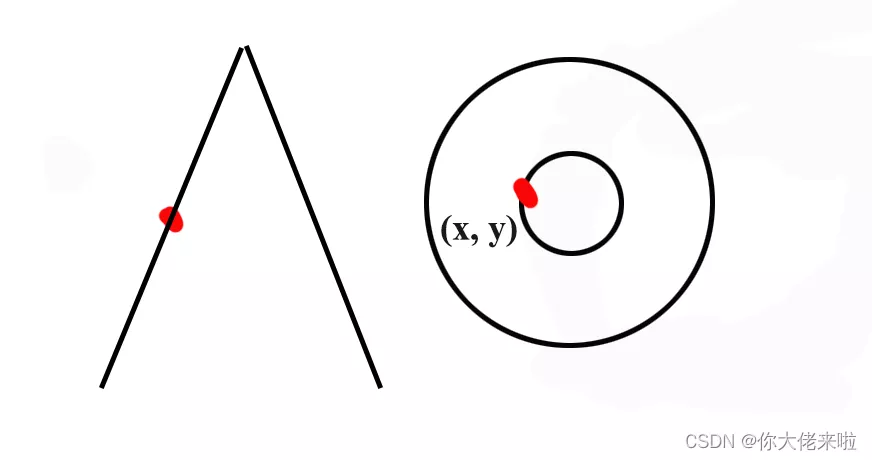
On the left is a mountain , The red dot above becomes a position in the coordinate system from a plane perspective , At this time, the height cannot be reflected in the contour map , This is why the contour map needs to be labeled with height values .
It will be more intuitive in combination with the three-dimensional diagram : Show the height of the above circular contour map with a three-dimensional image , The code used is :
from matplotlib import pyplot as pltfrom mpl_toolkits.mplot3d import Axes3Dimport numpy as npx = np.linspace(-3, 3, 50)y = np.linspace(-3, 3, 50)X, Y = np.meshgrid(x, y)Z = X**2 + Y**2 C=plt.contour(x, y,Z,[2,5,8,10])plt.clabel(C, inline=True, fontsize=10)fig=plt.figure()fig = plt.figure(figsize=(10,10))ax1 = plt.axes(projection='3d')ax1.scatter3D(X,Y,z, cmap='Blues')The effect is as follows :
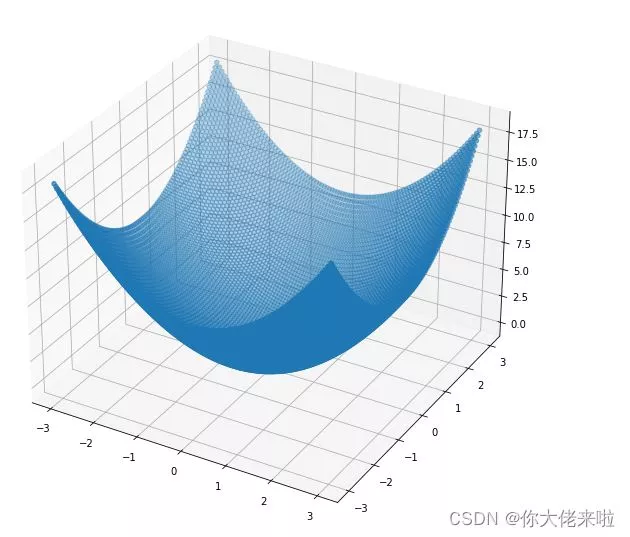
In the figure X,Y,Z Are transformed into coordinates in the three-dimensional coordinate system , It forms a height map of a part similar to a sphere .Z The axis is the height value corresponding to each point , Here, imagine if you drop the whole picture from the top to xy In two-dimensional coordinate system , If you take some fixed height values at the beginning ( Such as 2,5,8), If the coordinates corresponding to these fixed height values are connected in a two-dimensional coordinate system, they will become a contour line .
Here are a few more examples :
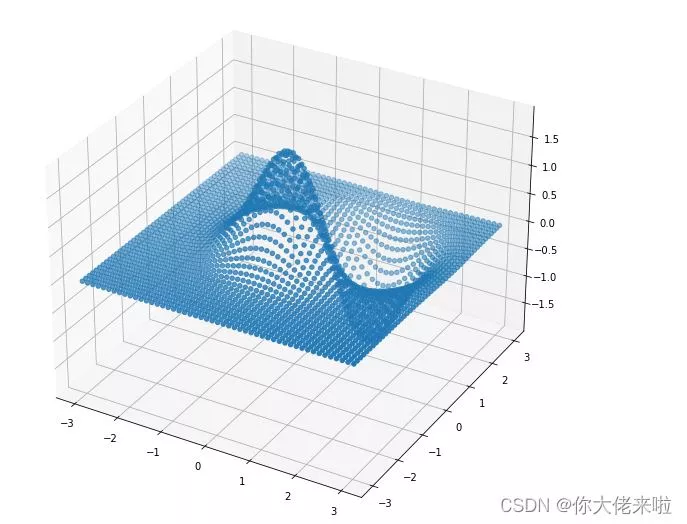
x = np.linspace(-3, 3, 50)y = np.linspace(-3, 3, 50)X, Y = np.meshgrid(x, y)z = (np.exp(-X**2 - Y**2) - np.exp(-(X - 1)**2 - (Y - 1)**2))*2fig=plt.figure()fig = plt.figure(figsize=(10,10))ax1 = plt.axes(projection='3d')ax1.scatter3D(X,Y,z, cmap='Blues')effect :
Its two-dimensional drawing is :
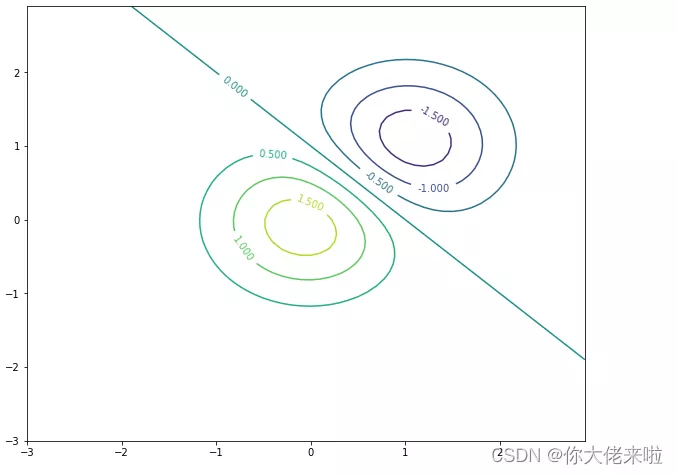
Sting !
Don't learn, don't know , I learned that nothing is as simple as I imagined .
Add :plt.contour Contour drawingimport numpy as npimport matplotlib.pyplot as pltdef height(x, y): return (1 - x / 2 + x ** 5 + y ** 3) * np.exp(-x ** 2 - y ** 2)x = np.linspace(-3, 3, 300)y = np.linspace(-3, 3, 300)X, Y = np.meshgrid(x, y)# Color contour lines 10 It means to divide by height 10 layer plt.contourf(X, Y, height(X, Y), 10, alpha=0.75, cmap=plt.cm.hot)C = plt.contour(X, Y, height(X, Y), 10, colors='black')# Draw contour labels plt.clabel(C, inline=True, fontsize=10)# Remove the axis scale # plt.xticks(())# plt.yticks(())plt.show()# display picture 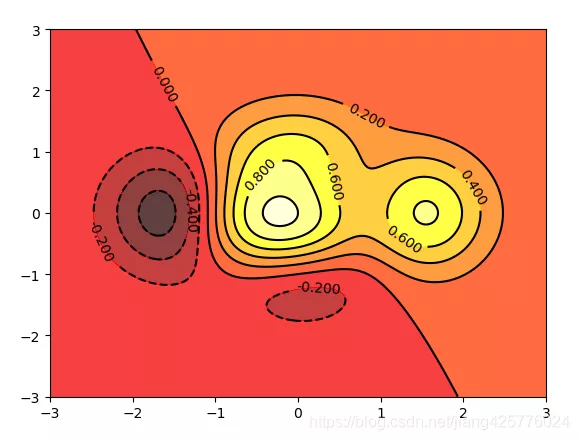
Reference resources :https://blog.csdn.net/qq_42505705/article/details/88771942
summaryThis is about python Drawing basis plt.contour This is the end of the article , More about python Make a picture plt.contour Please search the previous articles of software development network or continue to browse the relevant articles below. I hope you will support software development network more in the future !