Exploratory data analysis is the process of analyzing data sets to summarize the statistical significance of features and visualize the propagation of each feature through appropriate visual effects . however , When there are many features in a dataset , Visualizing each feature is a tedious task , Because checking the relevance of each feature will be a long process . therefore , This is it. EDA Where automated processes play an important role in reducing the total time spent on data analysis and in optimizing feature selection and outlier analysis .
This is where we need to automate the exploratory data analysis process , Various Python Kuhe API( Such as LUX、SweetViz、AutoViz etc. ) Support the automation of exploratory data analysis . In this paper , Let's explore how to use LUX Python API From the dynamic exploratory data analysis process .
Lux It's a Python library , It facilitates fast and easy data exploration through automated visualization and data analysis processes . By simply in Jupyter Print out the data frame in the notebook ,Lux A set of visualizations is recommended , Highlight interesting trends and patterns in the dataset . Visualization is displayed through interactive widgets , Enable users to quickly browse a large number of visual collections and understand their data .
LUX Some standard widgets supported under the module are as follows .
The correlation widget helps to analyze the correlation between two digital features of the data in the form of a scatter plot . All numerical features will be mapped into a set of two features , And it can visualize the correlation between the two features , In order to analyze features with higher correlation .
LUX python API The distribution widget of is responsible for generating histogram visual effects for all digital features , The count of each feature is provided through the histogram box . The distribution widget is mainly useful for analyzing the frequency of numerical characteristics
LUX python API The appearance widget of is responsible for generating horizontal bar graphs by analyzing the frequency of occurrence of classification features existing in the data . For each category feature and category feature of each category , Frequency appears under the appearance widget and is provided in visual form .
LUX API The geographic widget of basically shows the contour map of the geographic location in the data set . Calculate the average value of some digital features for each area on the map , Just hover over the map , You can calculate the average value of each region under each geographical location in the data .
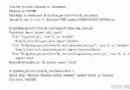
In this article , Let's see how to use LUX Python API From the dynamic exploratory data analysis process . In order to use LUX python API, We must first install... In the working environment LUX API.
!pip install lux-apiNow install... In your work environment LUX API after , Let's put... In the work environment API And pandas Modules are imported together to read datasets .
import lux
import pandas as pd
In some work environments , You must install the appropriate visual widgets to allow some to be used from API Widgets for visualization . Let's see how to allow LUX API stay Google Colab Generate visual effects in .
from google.colab import output
output.enable_custom_widget_manager()
Once the widget is set , The last step is to use... In your work environment pandas The module reads the data set .
df=pd.read_csv('/content/drive/MyDrive/Colab notebooks/EDA using LUX/WA_Fn-UseC_-HR-Employee-Attrition.csv')
df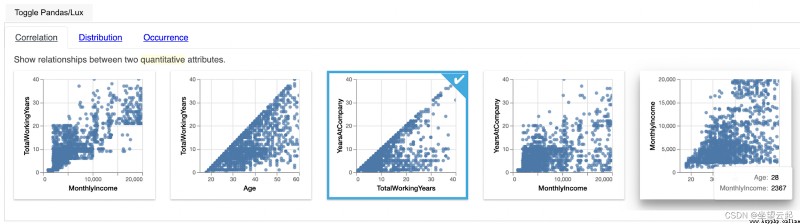
This is through LUX Read the data frame in the active working environment , The entire exploratory data analysis process is automated and generates various widgets .
In the diagram above , Let's consider the first figure, monthly income and total working hours , We can see how these two characteristics are related to each other .
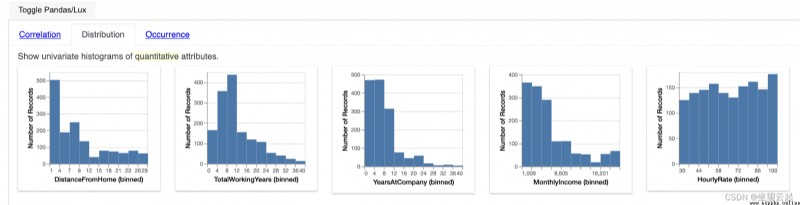
In the diagram above , If we consider the first graph , We can easily explain the occurrence frequency of each digital feature in the data set .
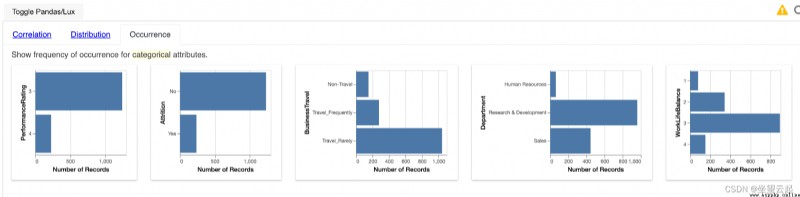
In the diagram above , If we consider the first graph , We can clearly see that there are two categories of characteristic performance ratings , We can also analyze the frequency of each category accordingly .
In addition to visualizing the entire dataset ,LUX It can also flexibly analyze the characteristics of the required characteristics , As shown below . But for the selected custom functions ,LUX API Three new widgets are supported under , namely Enhance、Filter and Generalize.
df.intent = ["YearsAtCompany","HourlyRate"]
df
Therefore, two numerical features are selected from the data to use LUX API To understand its various characteristics .
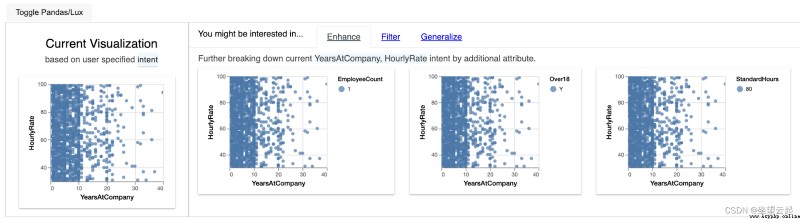
therefore , If you select the desired feature from the dataset , This is it. LUX API Generated visual widgets . Let's try to understand what each widget must communicate .
Automated exploratory data analysis helps reduce 60% Data cleaning and analysis . By automating exploratory data analysis , It is easy to optimize feature selection and check the correlation between features , Therefore, more time can be used to generate more general and reliable models for various tasks using data . stay python Various automatic exploratory data analysis API in ,LUX It's like this API, The whole analysis of data is through reading LUX Activate data in the environment to generate appropriate insights from the data .