A picture is worth a thousand words , Visualize information ( mapping ) It is one of the most important tasks in data analysis . In addition to making people more intuitive about data , It can also help us find outliers 、 Necessary data conversion 、 Get ideas about the model, etc .pandas In data analysis 、 Data visualization has a wide range of applications . This article will introduce pandas Data mapping for .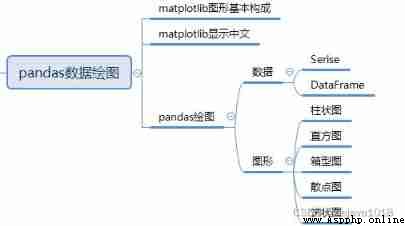
pandas The visualization of data depends on matplotlib Modular pyplot class ,matplotlib In the installation Pandas It will be installed automatically .Matplotlib You can control the details of graphics , Draw a graphic of the publication quality level , adopt Matplotlib, It can simply draw the commonly used statistical graphs .pandas Yes Matplotlib Based on the drawing software package, a plot() Interface , Common drawing operations can be realized by calling this interface .
Let's get to know mataplotlib The basic composition of graphics .
import matplotlib.pyplot as plt
import numpy as np
data=np.arange(10)
plt.plot(data)
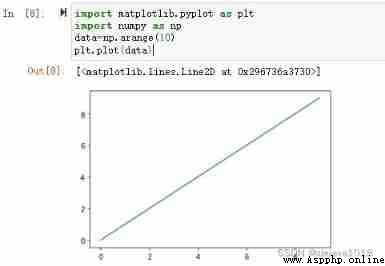
By introducing matplotlib Modular pyplot class , Send data to plot() The interface of , Data can be displayed graphically .Matplotlib The generated graphics are mainly composed of the following parts :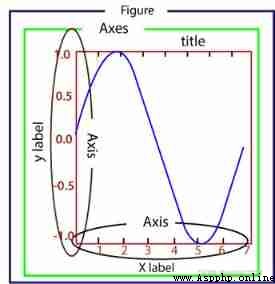
understand matplotlib The basic composition of graphics is very important , Drawing is through matplotlib Provides methods to define and set the constituent elements of these basic graphics to display data in these elements .
Matplotlib Chinese fonts are not supported by default , This is because Matplotlib Only support ASCII character , But Chinese labels are more in line with Chinese reading habits . Here's how to do it in Windows The environment makes Matplotlib According to Chinese .
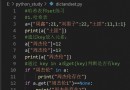
By temporarily rewriting the configuration file , Can solve Matplotlib Display the problem of Chinese random code , The code is as follows :
import matplotlib.pyplot as plt
plt.rcParams["font.sans-serif"]=["SimHei"] # Set the font
plt.rcParams["axes.unicode_minus"]=False # This statement solves the problem of “-” The garbled code of minus sign
By directly modifying the configuration file , It can be solved once and for all Matplotlib The problem of garbled Chinese . Note that this process is in Windows In an environment .
Matplotlib From the configuration file matplotlibrc Read relevant configuration information in , Like fonts 、 Patterns, etc , Therefore, we need to make changes to the configuration file . Use the following code to view matplotlibrc directory :
import matplotlib
matplotlib.matplotlib_fname()
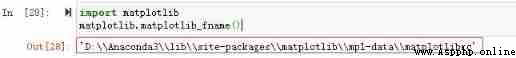
After opening the configuration file , Find the following information :
#font.family: sans-serif
#font.serif: DejaVu Serif, Bitstream Vera Serif, Computer Modern Roman, New Century Schoolbook, Century Schoolbook L, Utopia, ITC Bookman, Bookman, Nimbus Roman No9 L, Times New Roman, Times, Palatino, Charter, serif
Modifying the configuration will # Remove the comment , And Microsoft YaHei Microsoft YaHei Add... To the font of .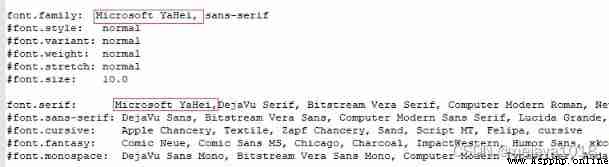
Last , stay windows Copy the Chinese font Microsoft YaHei in the font directory of :
C:\Windows\Fonts\Microsoft YaHei UI
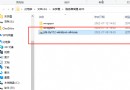
Copy and paste the Microsoft YaHei font into matplotlib Font library of , The font library path is in matplotlibrc In the directory
D:\Anaconda3\Lib\site-packages\matplotlib\mpl-data\fonts\ttf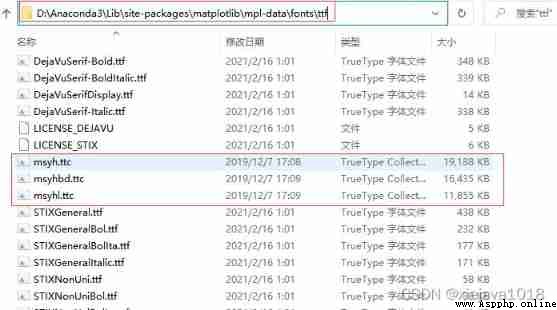
If it is jupyter notbook Restart jupyter notbook Let it reread the configuration file .
Data analysis is inseparable from data for visual drawing display ,pandas Two data structures of Series and DataFrame Both provide corresponding methods to facilitate the visual drawing display of data .
pandas Provides plot() Method can quickly and easily convert Series and DataFrame Visualize the data in .
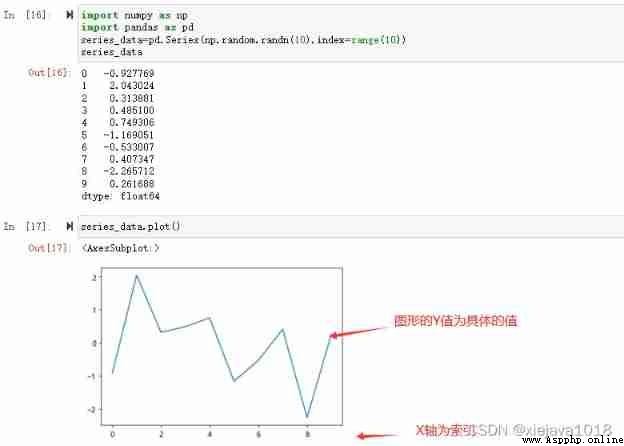
Series Use plot when x Axis as index ,y The axis is the specific value corresponding to the index :
import numpy as np
import pandas as pd
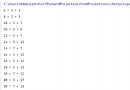
series_data=pd.Series(np.random.randn(10),index=range(10))
series_data
series_data.plot()
DataFrame Use plot when x Axis as index ,y The axis is a number of specific values corresponding to the index :
df_staff = pd.read_excel('D:\\Python\\study\\pythontest\\pandastest\\ Data sets \\staff_sale_byQ.xlsx')
df_staff
df_staff.plot()
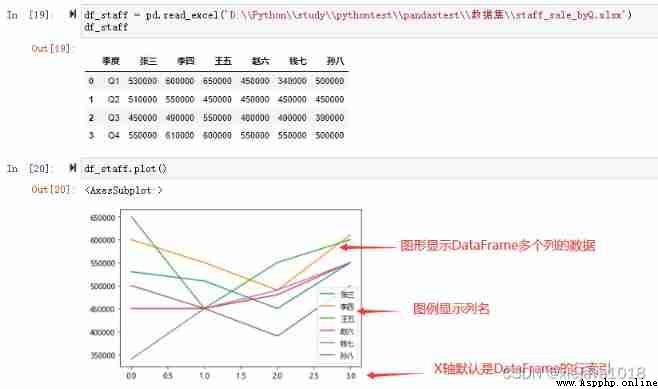
plot() You can pass in x and y Specify to display specific column data
# Appoint X Axis and y Displayed column data
df_staff.plot(x=' quarter ',y=[' Zhang San ',' Li Si '])
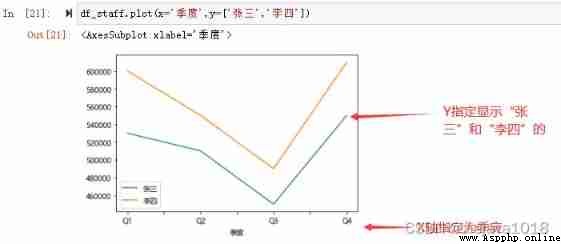
plot The default is line chart , Line graph is also the most commonly used and basic visual graph , Enough to meet our daily needs 80% The needs of .
In addition to using the default line drawing , You can also use other drawing methods , As shown below :
Histogram (bar chart), Use columns perpendicular to the axis , The number of data is expressed by the height of the column , Applicable to data comparison , We can also see the development and change trend of the data as a whole .
DataFrame Can be called directly plot.bar() Generate a line chart , Similar to line chart ,x Axis as index , Columns of other numeric types are y Bar on shaft , Parameters can be set stacked=True Generate a columnar stack diagram
df.plot.bar()
df.plot.barh() # The transverse
df[:5].plot.bar(x=‘name’, y=‘Q4’) # Appoint xy Axis
df[:5].plot.bar(‘name’, [‘Q1’, ‘Q2’]) # Appoint xy Axis
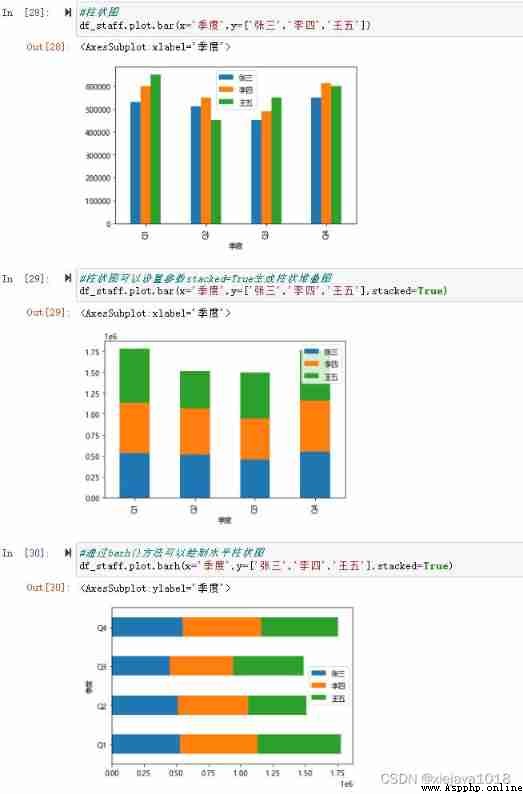
# Histogram
df_staff.plot.bar(x=' quarter ',y=[' Zhang San ',' Li Si ',' Wang Wu '])
# The histogram can set parameters stacked=True Generate a columnar stack diagram
df_staff.plot.bar(x=' quarter ',y=[' Zhang San ',' Li Si ',' Wang Wu '],stacked=True)
# adopt barh() Method can draw horizontal histogram
df_staff.plot.barh(x=' quarter ',y=[' Zhang San ',' Li Si ',' Wang Wu '],stacked=True)
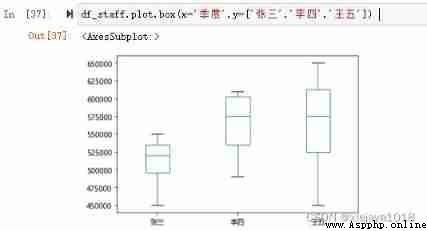
Box chart (Box Chart) Also known as box and whisker diagram 、 Box chart or box line chart , A statistical chart used to show the distribution of a set of data .Series.plot.box() 、 DataFrame.plot.box(), and DataFrame.boxplot() Can draw a box diagram .
From the box diagram we can observe :
df_staff.plot.box(x=' quarter ',y=[' Zhang San ',' Li Si ',' Wang Wu '])
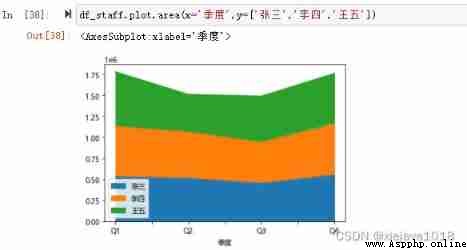
Area map (Area Chart), Also called area map . Fill the area between the line and the coordinate axis of the independent variable in the line graph with color or texture , Such a filled area is called area , Color filling can better highlight the trend information , It should be noted that the color should have a certain degree of transparency , Transparency can help users observe the overlapping relationship between different sequences , The transparency of different sequences can be reduced .
Area maps are stacked by default . To generate a stacked area graph , Each column must be all positive or all negative .
df_staff.plot.area(x=' quarter ',y=[' Zhang San ',' Li Si ',' Wang Wu '])
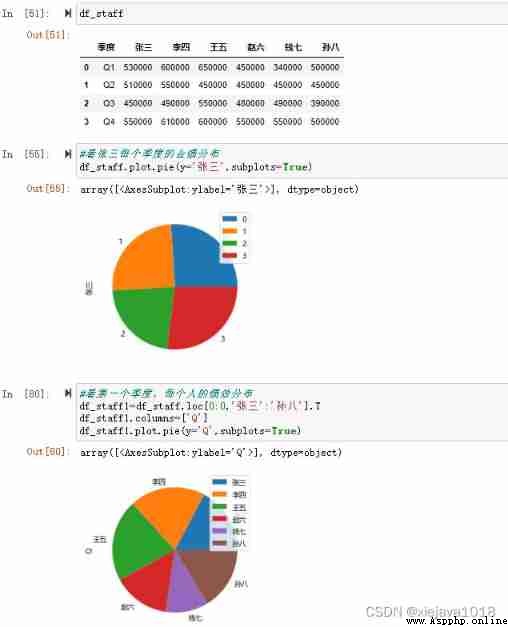
The pie chart (Pie Chart) Widely used in various fields , Used to indicate the proportion of different classifications , Compare various classifications by radian size . Pie chart is divided into several blocks according to the proportion of a circle pie , The whole pie represents the total amount of data , Every block ( arc ) Indicates the proportion of this classification to the total , All blocks ( arc ) The sum of plus is equal to 100%.
have access to DataFrame.plot.pie() or Series.plot.pie() Create pie charts
df_staff
# Look at Zhang San's quarterly performance distribution
df_staff.plot.pie(y=' Zhang San ',subplots=True)
# Look at the first quarter , Everyone's performance distribution
df_staff1=df_staff.loc[0:0,' Zhang San ':' Sun Ba '].T
df_staff1.columns=['Q']
df_staff1.plot.pie(y='Q',subplots=True)
Scatter plot (Scatter graph) Also called X-Y chart , It shows all the data in the form of points in the rectangular coordinate system , To show the degree of interaction between variables , The position of the point is determined by the value of the variable .
By observing the distribution of data points on the scatter plot , We can infer the correlation between variables . If there is no correlation between variables , Then, in the scatter diagram, it will be shown as randomly distributed discrete points , If there's a correlation , Then most of the data points will be relatively dense and present a certain trend .
df1 = pd.DataFrame(np.random.rand(50, 4), columns=["a", "b", "c", "d"])
df1.plot.scatter(x="a", y="b");

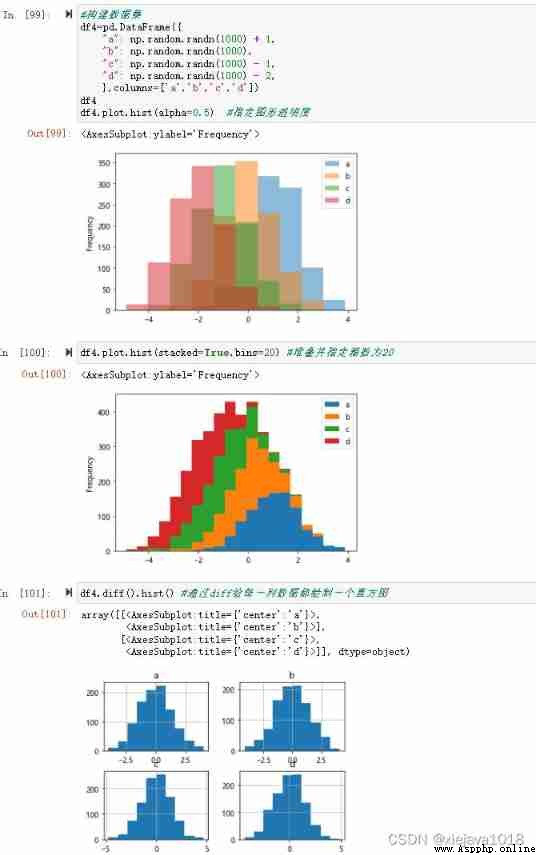
Histogram (Histogram), Also known as mass distribution diagram , It's a statistical report chart , It is based on the distribution of specific data , Draw with group spacing as the base 、 A series of rectangles connected by frequency .
# Build data set
df4=pd.DataFrame({

"a": np.random.randn(1000) + 1,
"b": np.random.randn(1000),
"c": np.random.randn(1000) - 1,
"d": np.random.randn(1000) - 2,
},columns=['a','b','c','d'])
df4
df4.plot.hist(alpha=0.5) # Specify drawing transparency
df4.plot.hist(stacked=True,bins=20) # Stack and specify the number of cases as 20
df4.diff().hist() # adopt diff Draw a histogram for each column of data
thus , This paper introduces pandas Common drawing components matplotlib, Include mataplotlib The basic composition of the drawing , How to be in windows Solve the Chinese problem , It also introduces how to pass pandas Draw line graph with the data set of 、 boxplot 、 Histogram 、 The pie chart 、 Area map 、 Scatter plot 、 Histogram, etc .
Reference material :《 utilize python Data analysis 》、pandas Official website user guide
Data set and source code are shown in :https://github.com/xiejava1018/pandastest.git
The author blog :http://xiejava.ishareread.com/