Study address
Catalog
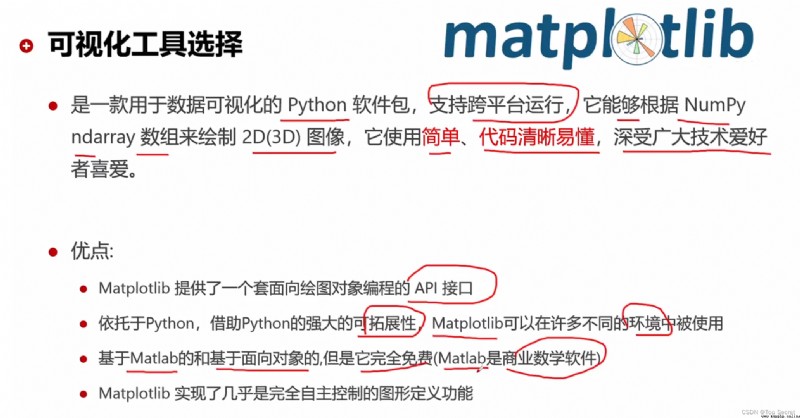
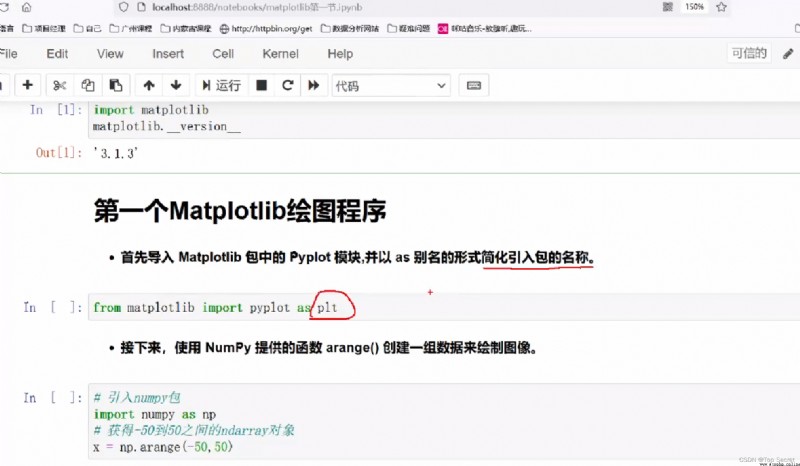
1. Basic concepts
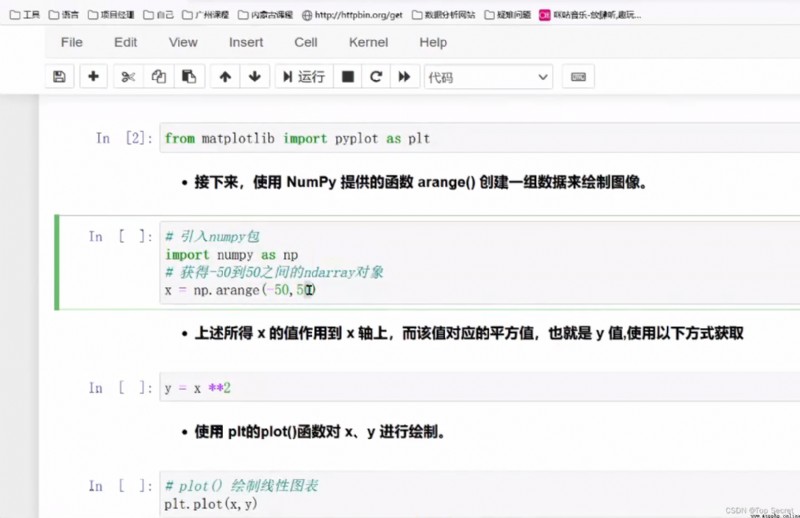
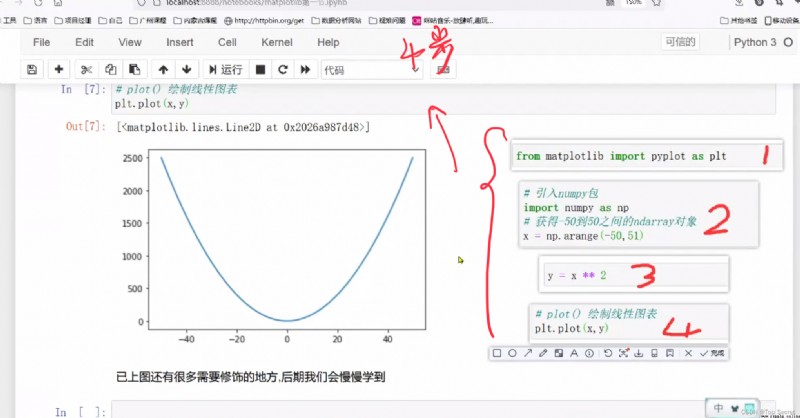
2. Draw linear table
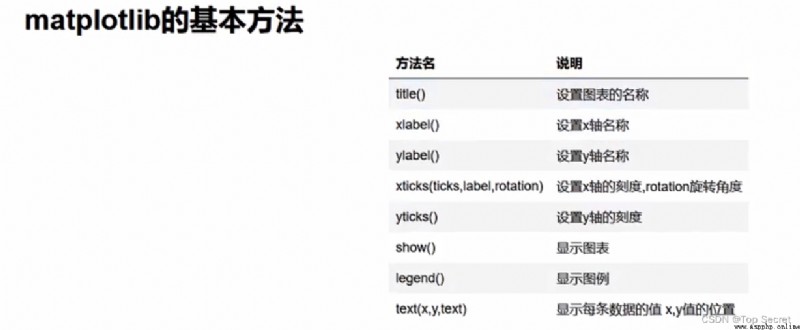
3.matplotlib Basic approach
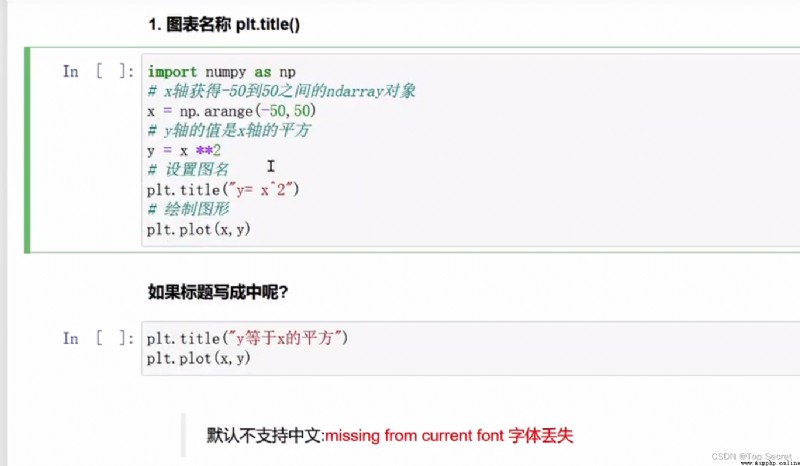
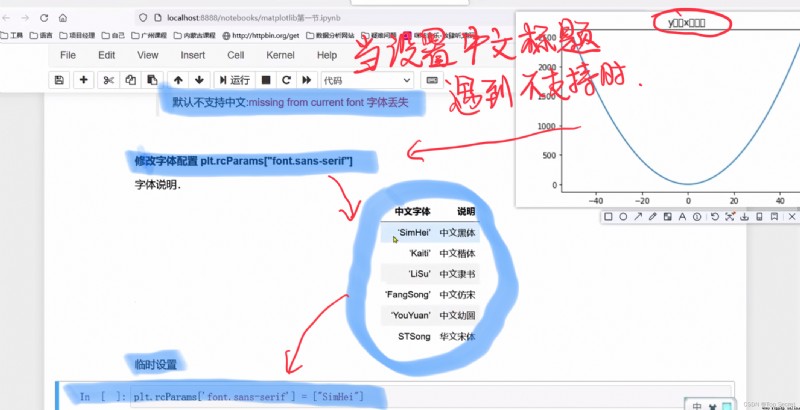
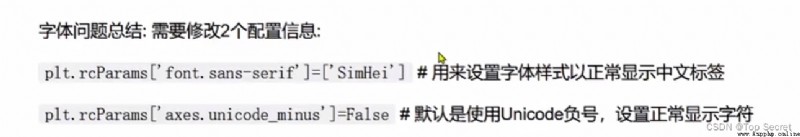
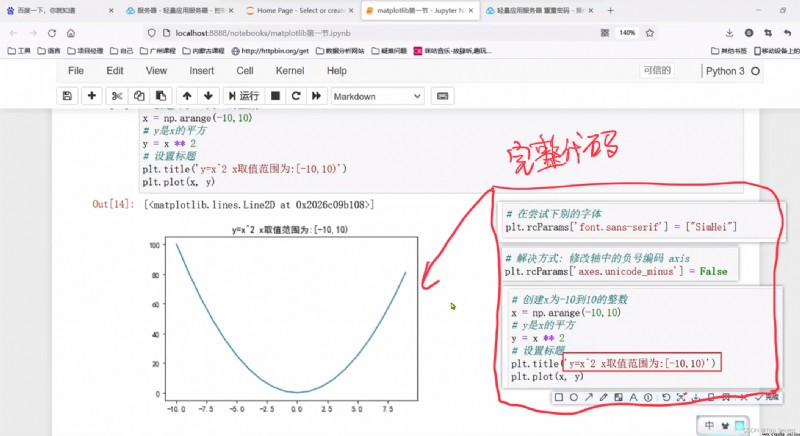
3.1 Chart name ( And the processing of chart names that do not support Chinese )
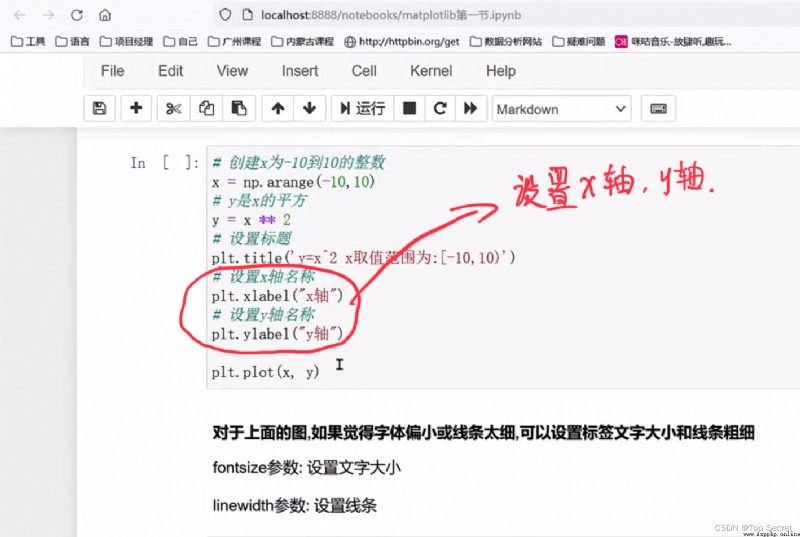
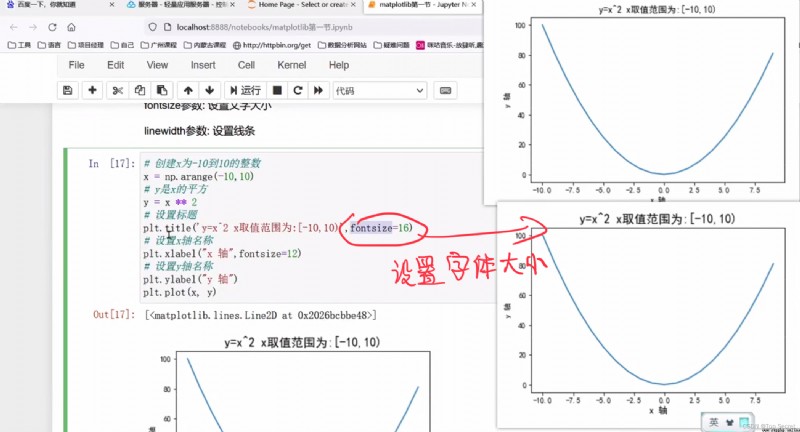
3.2 Set up x Axis ,y Icon name of axis ( Set font size )
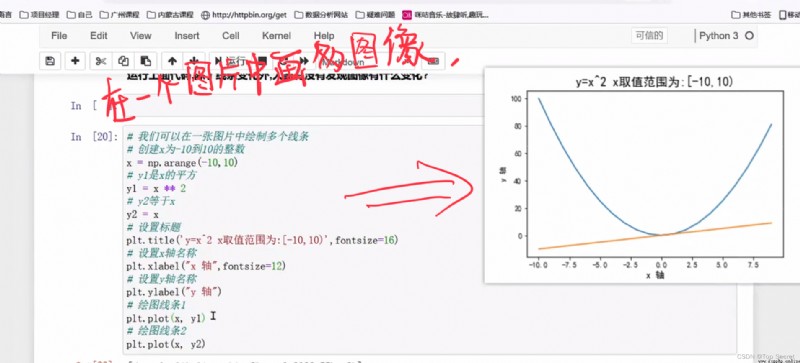
3.3 Draw multiple images in one picture
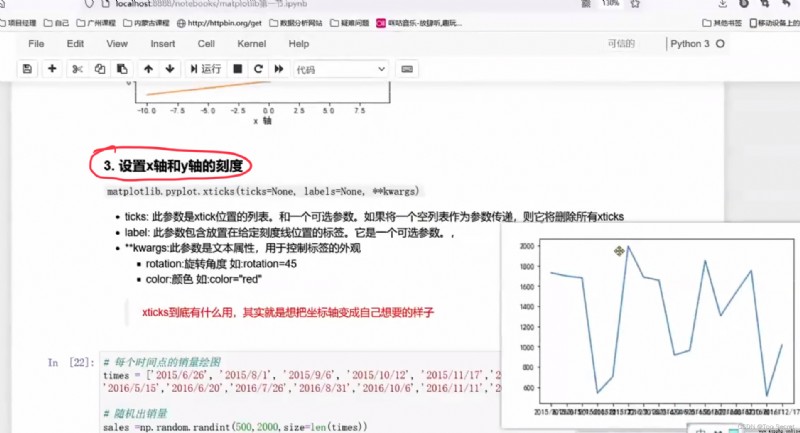
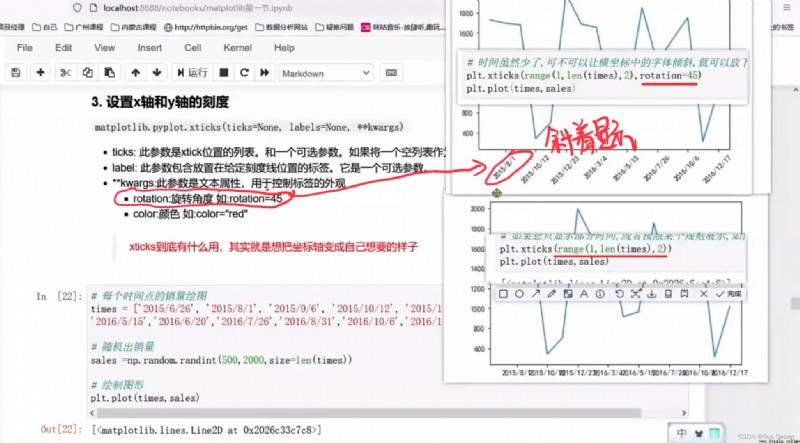
3.4 Set up x Axis and y Axis scale
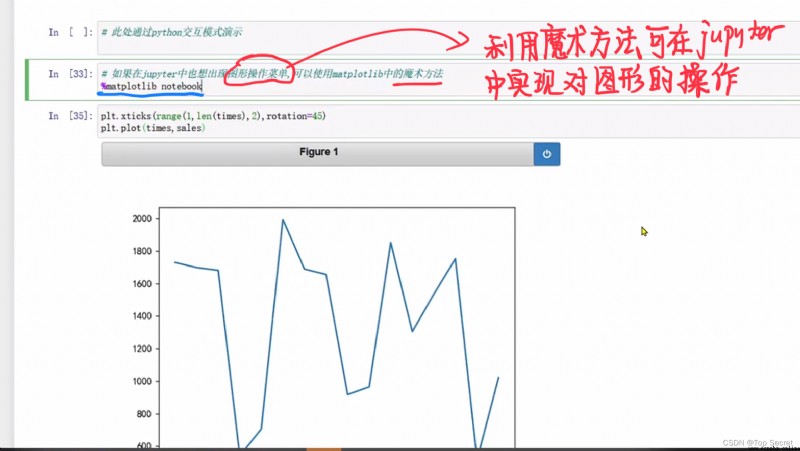
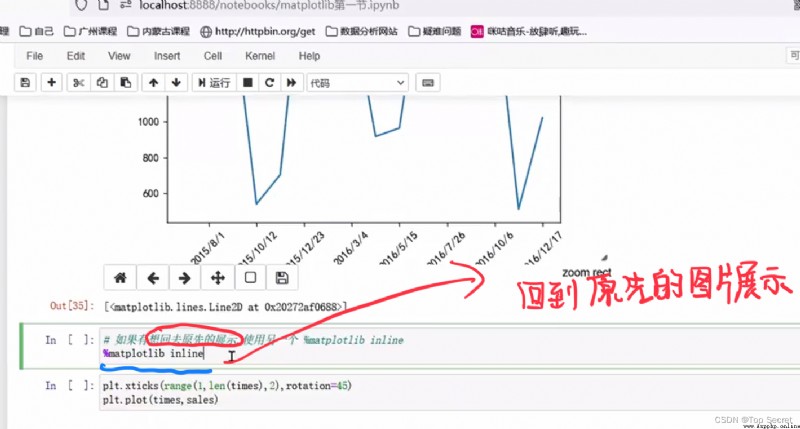
3.5 Realize the enlargement of the obtained graph , Zoom out and so on
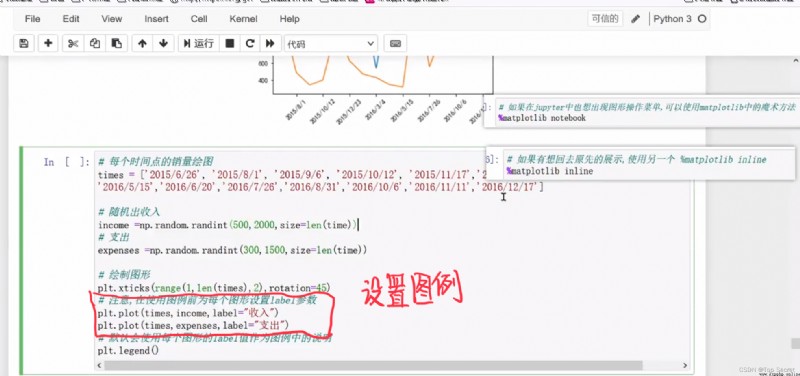
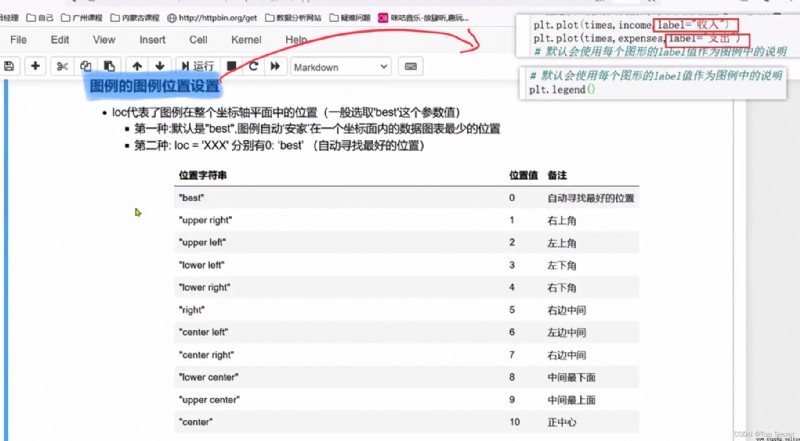
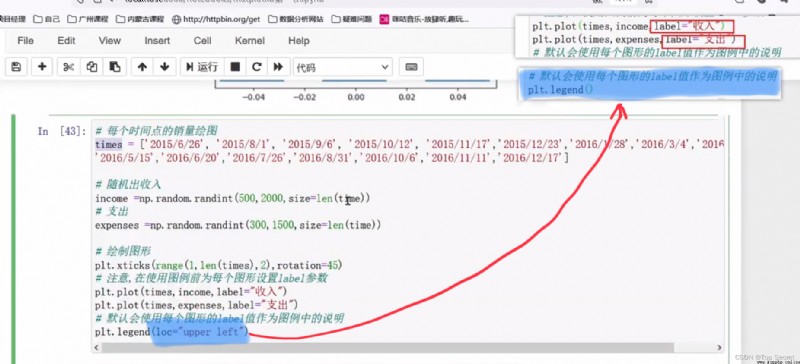
3.6 Set legend
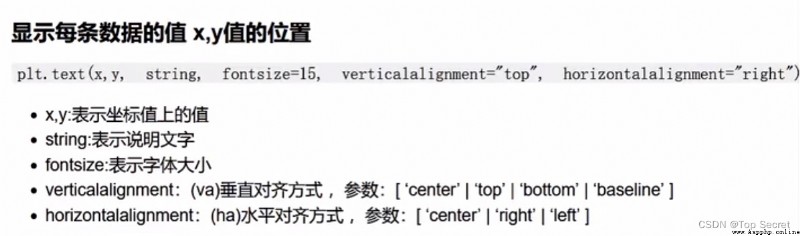
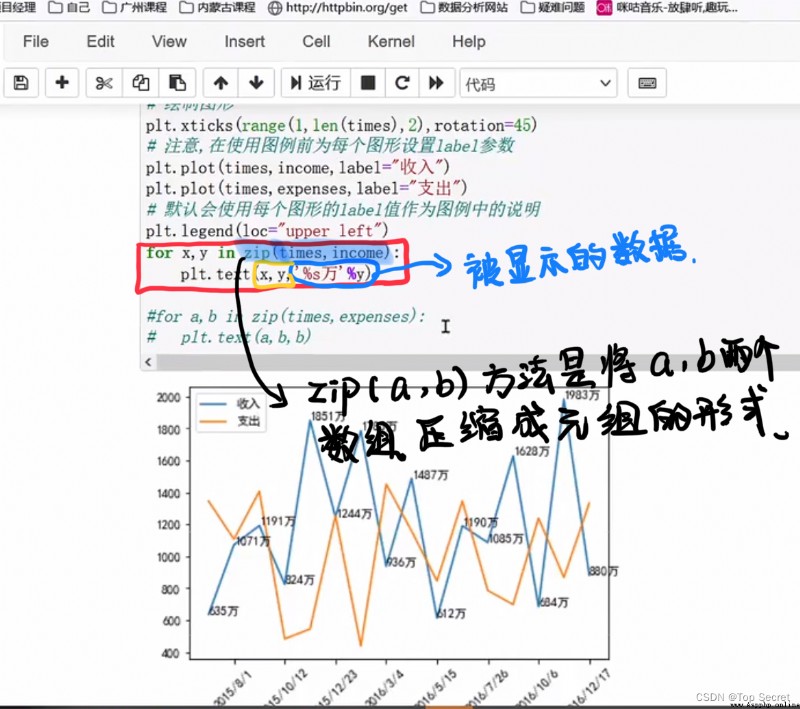
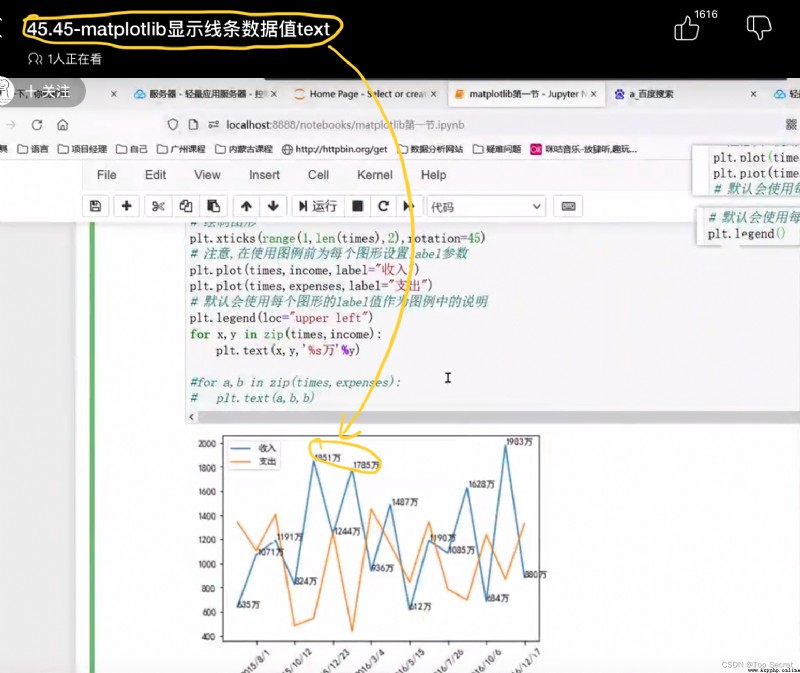
3.7 Display line data values (x,y Value position ) edit
4. Visibility of other elements
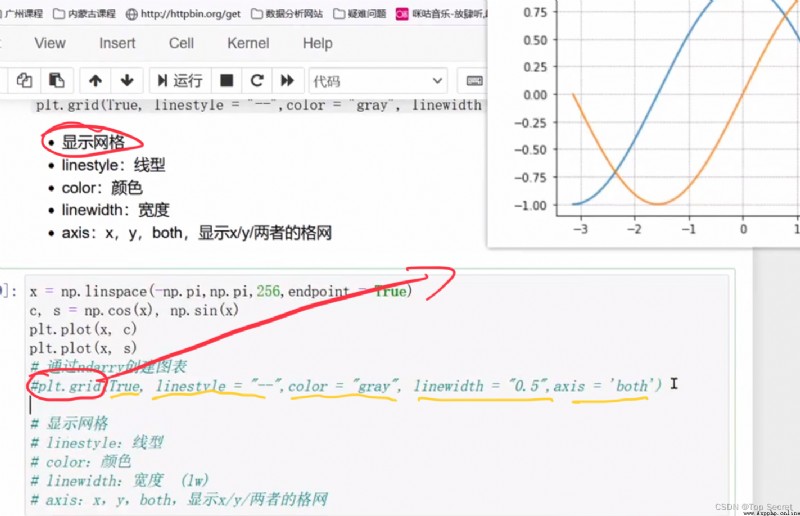
4.1 Show grid plt.grid()
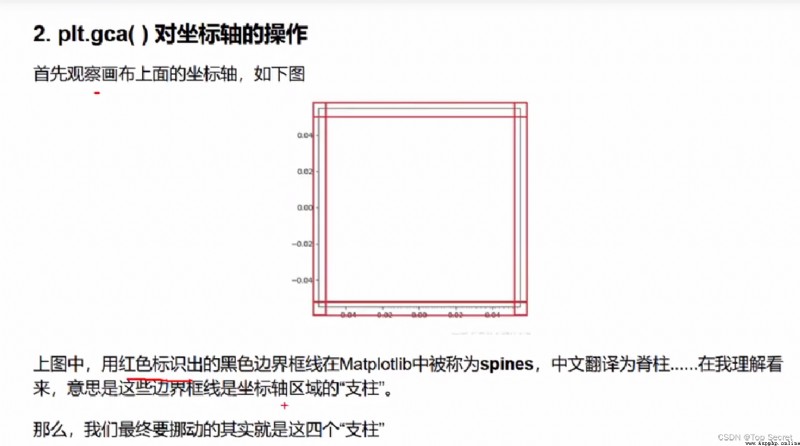
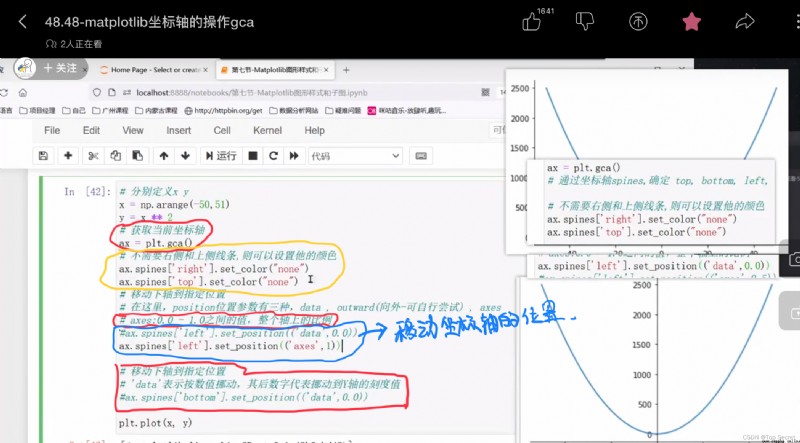
4.2 Translation of coordinate axis and other operations
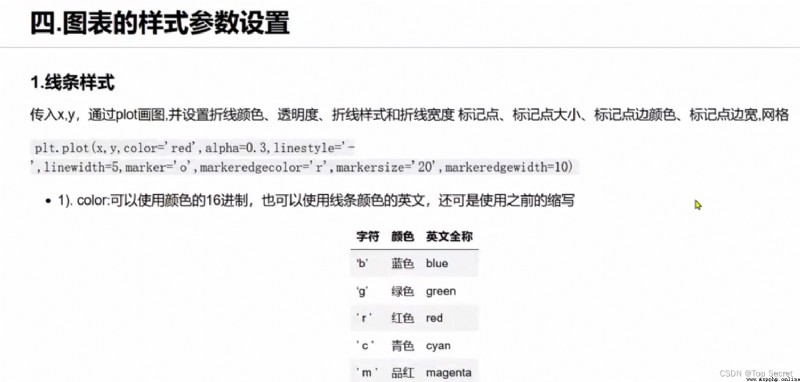
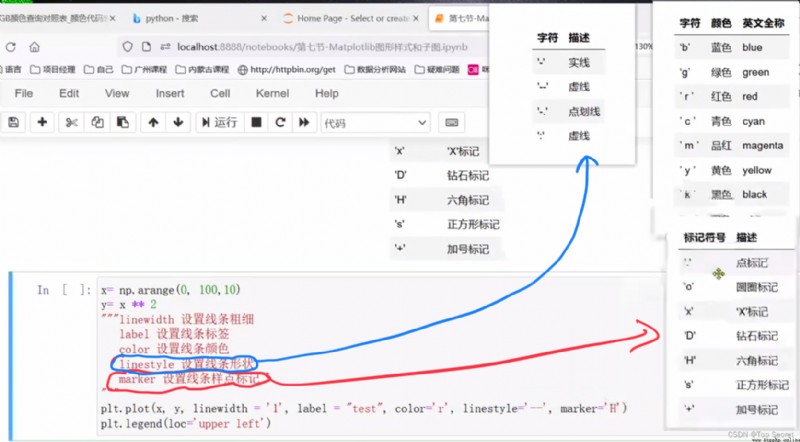
5. Chart style parameter settings
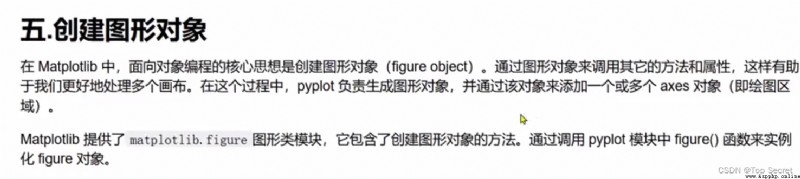
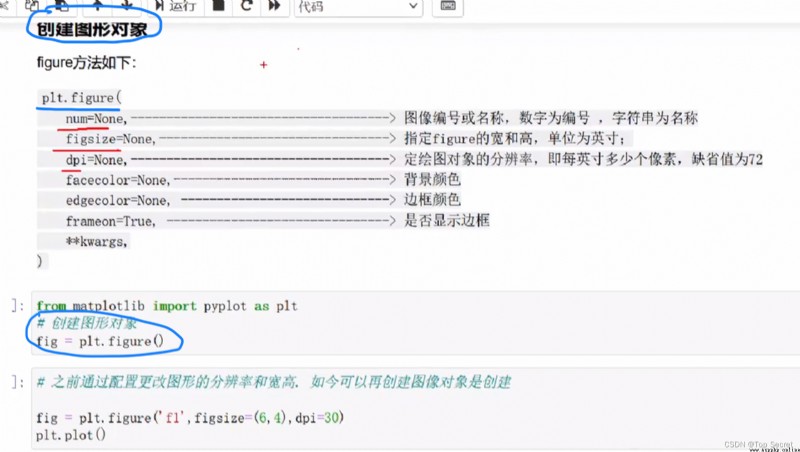
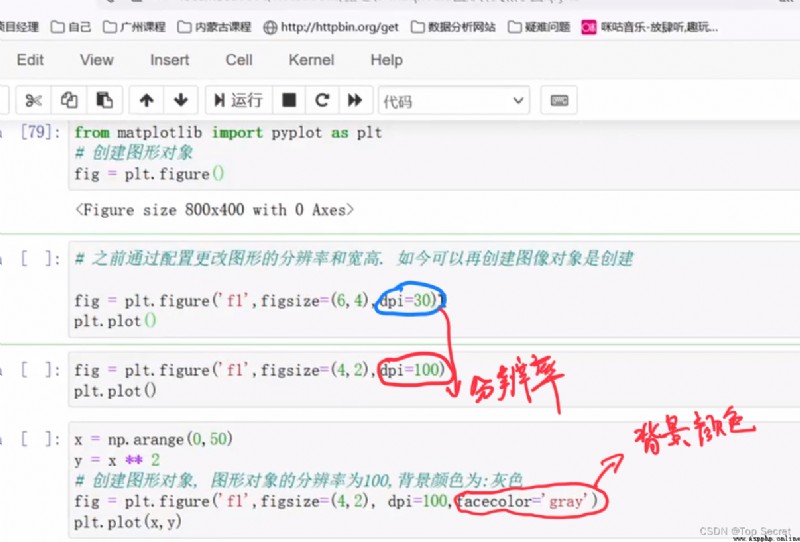
6. Create graphic objects ( canvas figure) edit
7. Drawing multiple subgraphs
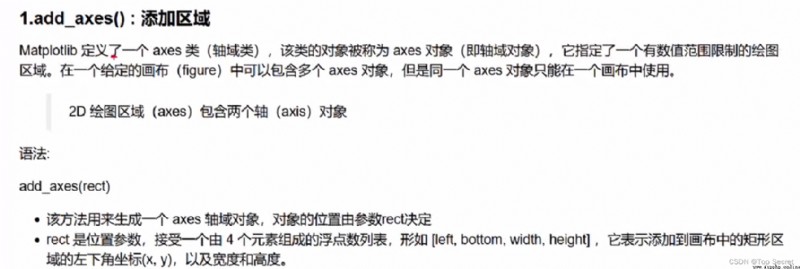
7.1 add_axes(): Add area


 Python tkinter - chapitre 7 contrôles de cadre (cadre et cadre détiquette)
No7Chapitre Contrôle du cadre(
 [Python automated test 21] interface automated test practice I_ Interface concept, project introduction and test process Q & A
List of articles One 、 Prefac