The average , Median and mode are commonly used statistical indicators to represent data level . When we want to compare the differences between different groups of data , Generally speaking, the average is used , But the average is susceptible to extremes , At this time, the median and mode are a better choice .
stay pandas in , We can use pivot_table Functions and groupby Function to find the grouping statistics . But they can't directly calculate the outstanding number . So here's the article . It's easy :
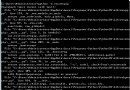
df = pd.DataFrame({
'a':['A','A','A','A','B','B','B','B','B'],'b':[1,1,2,3,1,2,2,3,3]})
df
def mode1(x):
restult = np.mean(pd.Series.mode(x))
return restult
pd.pivot_table(dfssss,index="a",values="b",aggfunc=mode1)