Use python While processing data , It is often necessary to draw three-dimensional drawings . The following is a record of the process of drawing a three-dimensional diagram with a given data list .
from matplotlib import pyplot as plt
from mpl_toolkits.mplot3d import Axes3D
# Define the axis
fig = plt.figure()
ax = plt.axes(projection='3d')
# ax = fig.add_subplot(111,projection='3d') # Draw multiple subgraphs
ax.plot_surface(xx, yy, zz, rstride=1, cstride=1, cmap='rainbow')
# ax.scatter3D(xx,yy,zz,cmap='red') # Scatter plot
# ax.plot3D(xx,yy,zz,cmap='red')
plt.show() # draw
Among them xx,yy,zz It needs to be dealt with .
2. Data processing
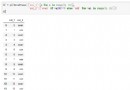
Given three lists . First the x and y An array of axes
x=np.arange(1,4,1) # Generate a numpy Array , Range [1,4), In steps of 1
y = [10,11,12,13] # python list
xx, yy = np.meshgrid(x, y) # take x,y Array extension
# xx = [[1 2 3]
# [1 2 3]
# [1 2 3]
# [1 2 3] ]
# yy = [[10 10 10]
# [11 11 11]
# [12 12 12]
# [13 13 13]]
z = [[10,20,30], # Array z Should also be 4*3 Array of
[11,22,33],
[12,24,36],
[13,26,39]]
zz = np.array(z) # python The two-dimensional array is converted to numpy Array
# One x And a y Corresponding to one z, namely xx The first line in and yy The first line in corresponds to zz The first line in
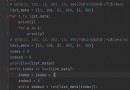
from matplotlib import pyplot as plt
from mpl_toolkits.mplot3d import Axes3D
# Define the axis
fig = plt.figure()
ax = plt.axes(projection='3d')
x=np.arange(1,4,1)
y = [10,11,12,13]
xx, yy = np.meshgrid(x, y)
z = [[10,20,30],
[11,22,33],
[12,24,36],
[13,26,39]]
zz = np.array(z)
ax.plot_surface(xx, yy, zz, rstride=1, cstride=1, cmap='rainbow')
plt.show()
Last figure , Because the data changes proportionally , So the picture is z The plane is a straight line .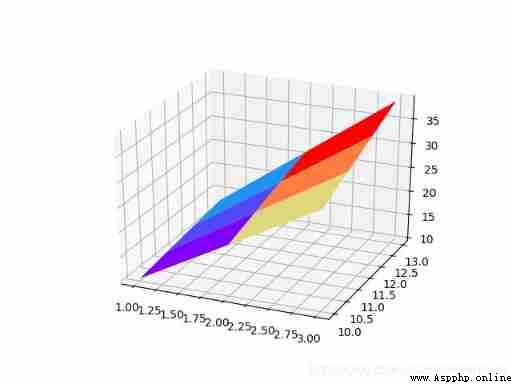
if necessary x If the axis is divided into scales according to the given data , stay ax.plot_surface() Followed by plt.xticks(list), In parentheses are list types .
For example, add a sentence plt.xticks([1,2,3]), The result is as follows :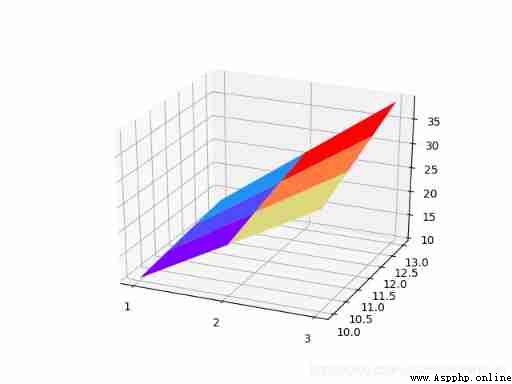
 Notepad + + fin de ligne début ajouter une chaîne - Win32 - pipe Technology - Shared Memory Technology - parent Process Data Exchange - How to add a directory in csdn - Python - font to Text
Catalogue des articles1.notepa