Catalog
3D Three dimensional figure
3D mapping
3D Scatter plot
3D diagram
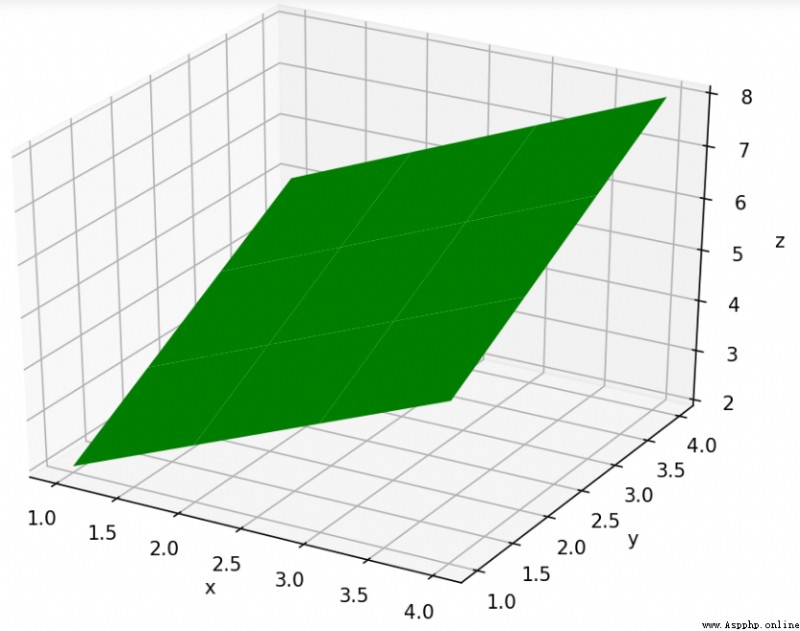
3D plan
Drawing three-dimensional images mainly through mplot3d Module implementation .
from matplotlib import pyplot as plt
from mpl_toolkits.mplot3d import Axes3D
%matplotlib notebook
3D Drawing and 2D The method of drawing is basically the same , The difference is , The object of the operation becomes Axes3D() object .
from matplotlib import pyplot as plt
import numpy as np
from mpl_toolkits.mplot3d import Axes3D
x = np.random.rand(100)
y = np.random.rand(100)
z = np.random.rand(100)
fig = plt.figure()
ax = Axes3D(fig)
ax.scatter(x,y,z,s=10,color="r",marker='o')
plt.show()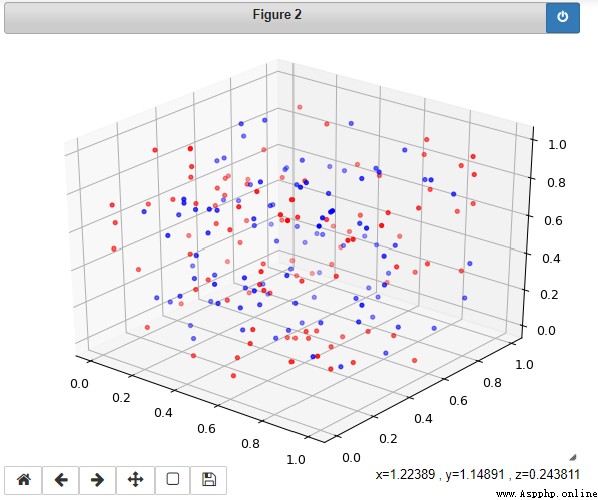
from matplotlib import pyplot as plt
import numpy as np
from mpl_toolkits.mplot3d import Axes3D
zline = np.linspace(0,15,1000)
xline = np.sin(zline)
yline = np.cos(zline)
fig = plt.figure()
ax = Axes3D(fig)
ax.plot(xline,yline,zline)
plt.show()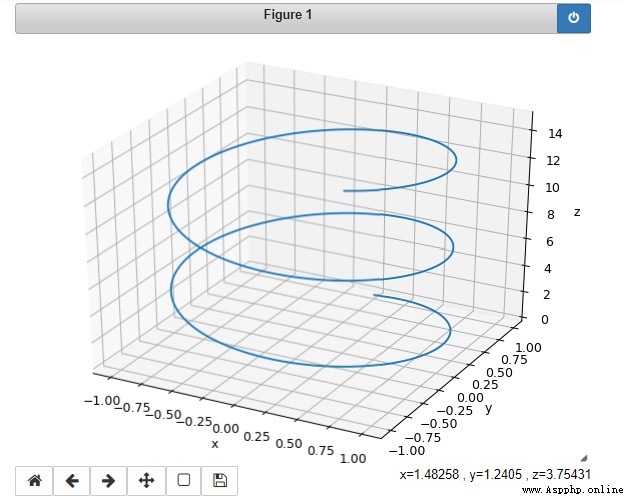
x = [1,2,3,4]
y = [1,2,3,4]
X, Y = np.meshgrid(x, y)
# Create a canvas
fig = plt.figure()
# establish 3D Coordinate system
ax = Axes3D(fig)
ax.plot_surface(X,
Y,
Z=X+Y
)
 How does pandas change from one line to another (splicing and aggregating text)?
1. Scenario introduction Some
 Using Python to do stock analysis of new energy companies (visualization)
This article only has some cod