plt.plot() Analysis of function parameters
The specific meaning of each parameter is :
x,y
color
linestyle
linewidth
marker
About marker Parameters of
plt.plot() Analysis of function parametersplt.plot() The line graph() function draws a line graph , It has many parameters , Common function parameters are as follows :
plt.plot(x,y,color,linestyle,linewidth,marker,markersize,markerfacecolor,markeredgewidth,markeredgecolor) The specific meaning of each parameter is :x,yx,y Namely X Axis data and Y Axis of the data , Their types can be tuples , list ,numpy Library array Object or pandas Library series object , These two libraries will be explained later , This section uses lists to create data .
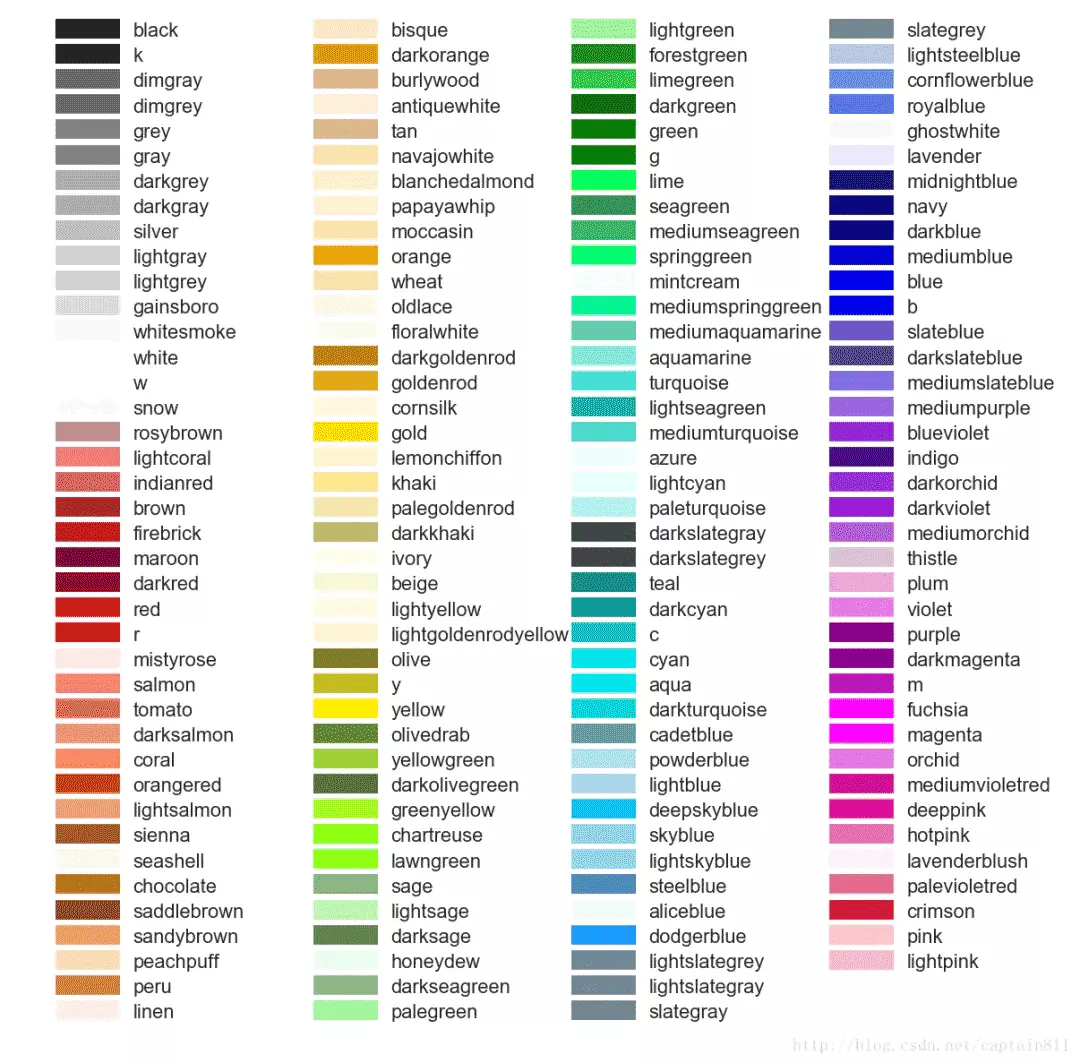
colorThe color of the line , Usually write the English name of the color directly ( Use a pair of single quotation marks ) Or 16 system .python The English name of the recognizable color is shown in the figure below :
Style or style of line , The following styles are commonly used ,
'-': Solid line
'--' : Broken line
'-.' : Point line
':' : Dotted line
linewidthThe width of the polyline , The greater the numerical , The thicker the lines .
markerThe sign , That is, the display style of each data point in the coordinate system , Commonly used :
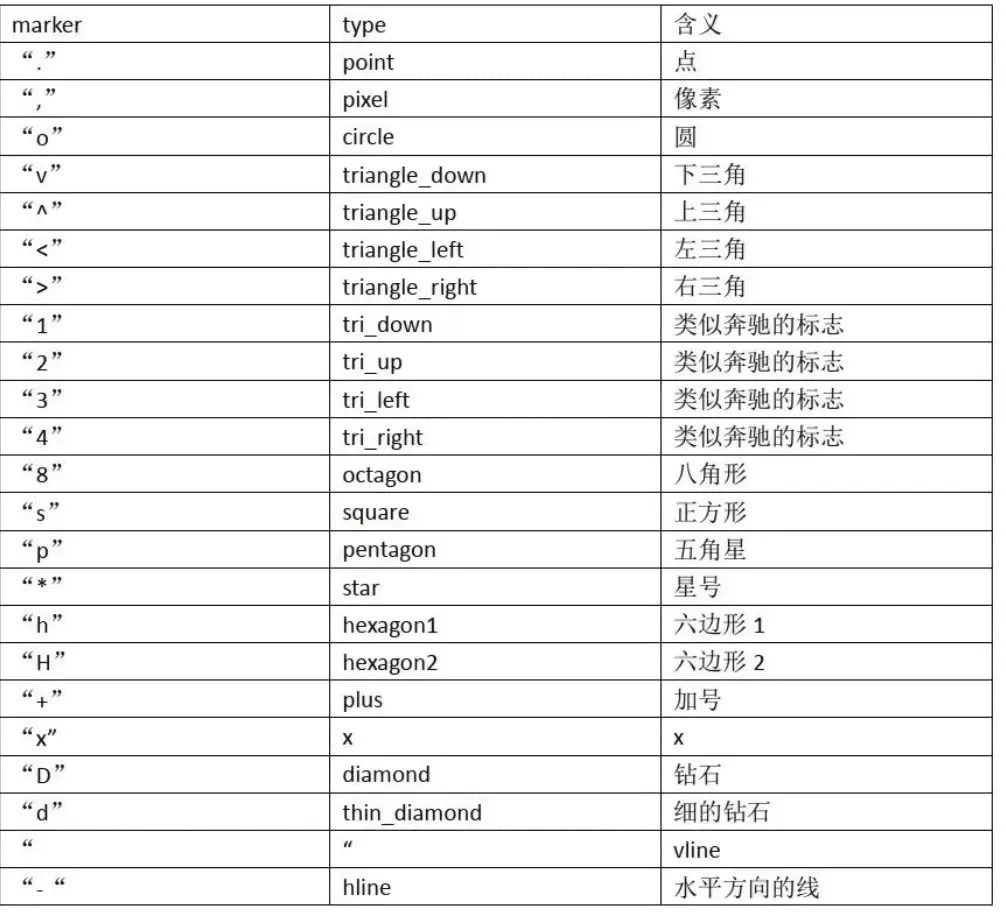
markersize: Mark the size of the symbol .
markerfacecolor: The color of the marking symbol .
markeredgewidth: The width of the edge of the marker symbol .
markeredgecolor: The edge color of the marking symbol .
import matplotlib.pyplot as plt plt.rcParams['font.family']=['SimHei']plt.figure(figsize=(7,7)) # Setting the graph size is a 7*7 The square of month=['1 month ','2 month ','3 month ','4 month ','5 month ','6 month ']telephone=[100,90,105,110,85,120] # Mobile phone charges water=[10,9,20,30,25,18] # charge for water food=[500,600,500,480,400,660] # Food expenses other=[200,420,300,380,320,280] # Other expenses plt.plot(month,telephone,label=' The phone ',color='y',linestyle=':',marker='v')plt.plot(month,water,'go-',label=' charge for water ')#'go-' Is the abbreviation of three parameters ,g yes color Value , namely green,o yes marker Value , That is, the solid mark ,- yes linestyle Value , Solid line plt.plot(month,food,label=' Food expenses ',linestyle='--',marker='+',markersize=20,markerfacecolor='black',markeredgewidth=5,markeredgecolor='red')plt.plot(month,other,label=' Other ',linestyle='-.',marker='D')plt.legend() # Show Legend plt.grid(ls='--',alpha=0.4) # Show grid plt.title(' Trend chart of various expenses in the first half of the year ') # Set chart title plt.xlabel(' month ') #X Axis title plt.ylabel(' amount of money ') #y Axis title plt.show()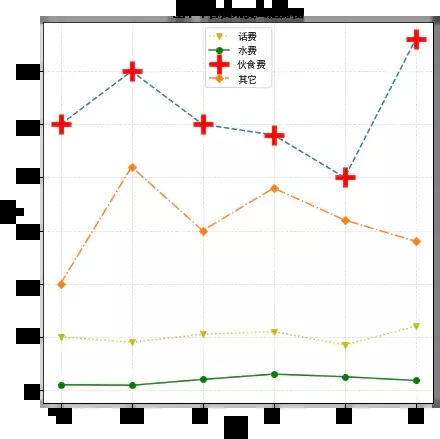
Use plt.plot() Function when drawing a line graph , except X Axis data and Y Axis data is necessary , Other parameters are optional , For example, color. , If not set ,python The compiler will automatically help you set the colors of the four lines to be inconsistent . So we can select the parameters to be set according to the actual needs .
That's all python Data visualization matplotlib Draw the details of the line chart example , More about python matplotlib Please pay attention to other related articles of software development network for the information of drawing line chart !
 Python office automation practice 15 | Python docx Library: the perfect combination of Python and word_ Realize one click batch search and replacement of multiple word documents
One 、 Introduction to the topi
 Python writes a little game: guess idioms by looking at pictures (Part 2)
List of articles Preface Loo