In the process of data cleaning, we often encounter problems such as outliers and missing values , occasionally , Will treat outliers as missing values . General missing value processing methods include : Delete 、 Statistical value filling ( mean value 、 Median, etc )、 Regression equation predicts filling, etc .
Using the direct delete method is simple and easy , But the disadvantage is , In the case of less recorded data , It will further reduce the sample size , It may change the original distribution of response variables , Resulting in inaccurate analysis results . therefore , The advantage of treating outliers as missing values lies in that the information of existing variables can be used for modeling and mining , For outliers ( Missing value ) Fill in .( The purpose of this paper is to explore how to use regression equation to predict and estimate , For outliers 、 Operation method of filling with missing values )
Regression equation filling method , Is to select several independent variables that can predict the missing values , Estimating missing values by establishing regression equations . This method can make full use of the information in the original data set , But there are also some shortcomings :1. Although this is an unbiased estimate , But it ignores random errors , Underestimate the standard deviation and other measurements of unknown properties .2. Before using , It must be assumed that the variable with missing values has a linear relationship with other variables , But in reality, they do not necessarily have such a linear relationship , This can be distinguished with the help of statistical tools , But it often needs more practical experience and business knowledge of modelers to analyze and judge .
Fill in variables with missing values as needed , Split the original data set into 2 A subset of (1. No missing values :dataset_train; 2. Contains only missing values dataset_pred)
Empirical analysis determines which attributes are listed in relation to variables that fill missing values , Apply statistical analysis tools , stay dataset_train View on the dataset to verify the correlation between the selected attribute columns .
Use dataset_train Set up linear regression model , And apply the built model to dataset_pred The missing variables in the data set are predicted and estimated
Restore two subsets together into one dataset , Prepare data for subsequent modeling .
Data set description :
The data set is intercepted from a computational intensity ( The response value is ”strength“) As an example, some of the original data of .
In this case "force" Is an important feature , But with missing values , Try to use the regression equation to predict the filling missing value , To build a forecast "Strength" Model data preparation .
Load the data and determine the characteristics that need to be filled with missing values :
Split datasets :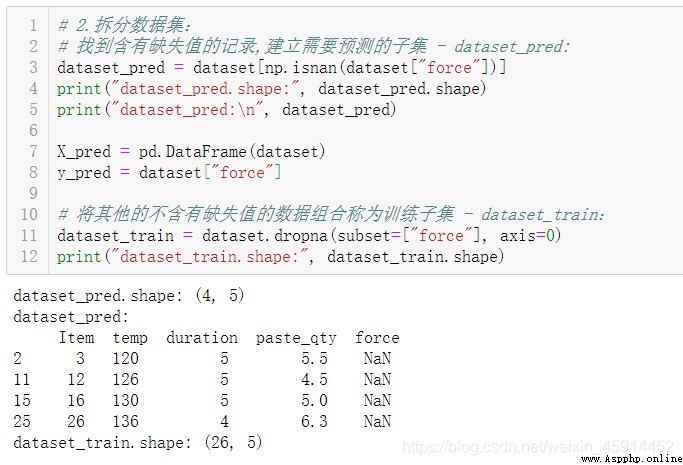
Find out "item" by 3, 12, 16, 26 Of "force" The feature has missing values . Considering that the amount of data is not too much , Check variables ”force“ Whether it conforms to the normal distribution .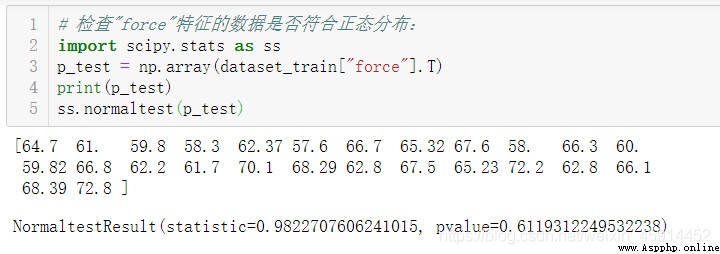
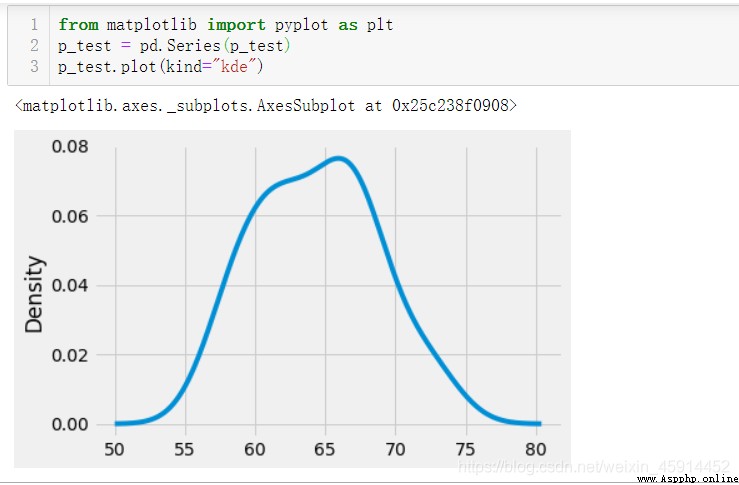
The results of the above analysis show that :p The value is 0.612, Greater than 0.05, The characteristic data conform to the normal distribution .
Analyze and test the correlation of relevant variables :
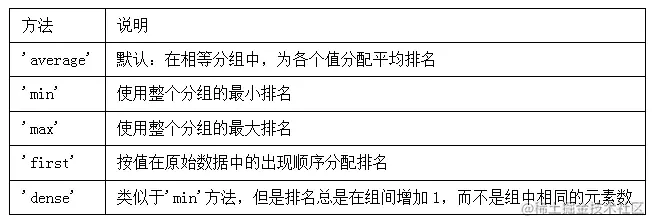
According to practical experience, we can learn that , Welding drawing force will be affected by temperature (temp)、 Time (duration) And amount of solder paste (paste_qty) Etc , therefore , We will choose to make use of the above 3 The regression equation is established by three factors , Before that, check each factor and prediction variable (force) The correlation between .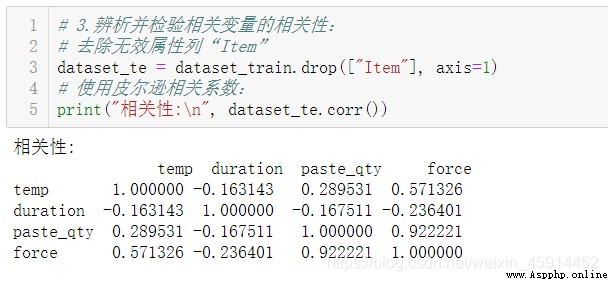
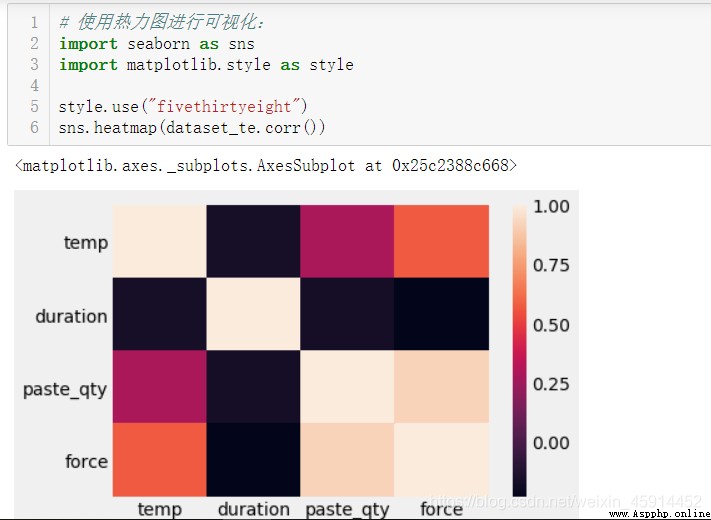
The above results show that : The factors we choose are related to “force” There is a certain correlation between attributes .
Model and predict :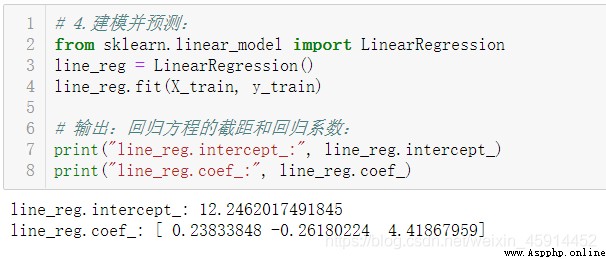
The regression equation thus obtained is :
force = 12.246 + 0.238 * temp - 0.262 * time + 4.419 * paste_qty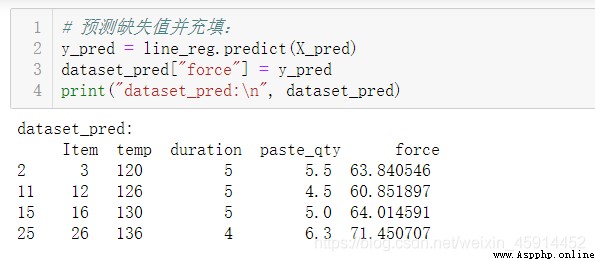
By modeling , Estimated at "force" Medium 4 Missing values .
Merge restore datasets :
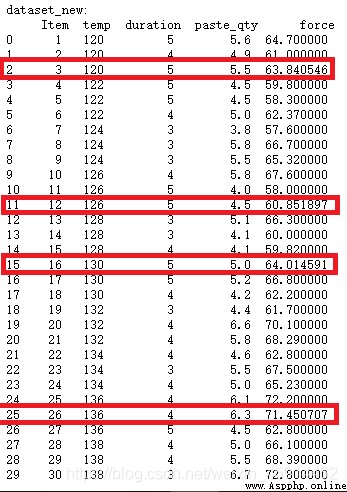
Check "item" by 3, 12,16,26 Of "force" features , The results show that the original missing values have been filled in by the predicted values using the regression equation !