pandas It is very good at processing one-dimensional data and two-dimensional data , It is widely used in the actual production environment . We went straight to the subject , This article mainly explains its two core data structures :Series and DataFrame.
One ,Series ( A one-dimensional , Array with labels )
ta It's a fixed length dictionary sequence . It is said that the fixed length is due to the storage time , It's equivalent to two ndarray, An array makes up the key of an object (index), Another value that makes up the object (values) This is also the biggest difference from the dictionary structure . Because in the structure of the dictionary , The number of elements is not fixed .
ta There are two basic attributes :index and values. stay Series In structure ,index The default is 0,1,2,…… An increasing sequence of integers .
1, establish
from pandas import Series, DataFrame
x1 = Series([1, 2, 3, 4])
x2 = Series(data=[1, 2, 3, 4], index=['a', 'b', 'c', 'd'])
d = {'a': 1, 'b': 2, 'c': 3, 'd': 4}
x3 = Series(d)
print x3
'''
The following is x1 Output result of :
0 1
1 2
2 3
3 4
dtype: int64
'''
print x1
'''
The following is x2 Output result of :
a 1
b 2
c 3
d 4
dtype: int64
'''
print x2
'''
The following is x3 Output result of :
a 1
b 2
c 3
d 4
dtype: int64
'''
print x3
2, Slicing and indexing
t = pd.Series(np.arange(10), index=list(string.ascii_uppercase[:10]))
'''
The output is as follows :
A 0
B 1
C 2
D 3
E 4
F 5
G 6
H 7
I 8
J 9
dtype: int64
'''
print t
# 1, section , The parameter passed in this time is : start,end,step
se1 = t[2:10:2]
'''
C 2
E 4
G 6
I 8
dtype: int64
'''
print se1
# 2, Indexes , Get sequence number as 1 Value , The following acquisition methods and this :se2=t['B'] It is equivalent.
se2 = t[1]
'''
1
'''
print se2
# 3, Indexes , When obtaining values corresponding to multiple sequence numbers , And this se3 = t[['C', 'D', 'G']] It is equivalent.
se3 = t[[2, 3, 6]]
'''
C 2
D 3
G 6
dtype: int64
'''
print se3
# 4, Indexes , Get serial number ( Is the default index ) Greater than 5 The data of
se4 = t[t > 5]
'''
G 6
H 7
I 8
J 9
dtype: int64
'''
print se4
Two ,DataFrame( A two-dimensional Series Containers )
DataFrame The type data structure is similar to a two-dimensional table . It includes row index and column index , We can DataFrame Think of it as being indexed by the same Series The dictionary type of composition .
Row index : Show different lines , Horizontal index , be called index,0 Axis ,axis=0
Column index : Show different columns , Vertical index , It's called columns,1 Axis ,axis=1
1, establish
from pandas import Series, DataFrame
data = {'Chinese': [66, 95, 93, 90, 80], 'English': [65, 85, 92, 88, 90], 'Math': [30, 98, 96, 77, 90]}
df1 = DataFrame(data)
df2 = DataFrame(data, index=['ZhangSan', 'LiSi', 'WangWu', 'XiaoMing', 'LiHua'],
columns=['English', 'Math', 'Chinese'])
'''
The following is df1 Return result of :
Chinese English Math
0 66 65 30
1 95 85 98
2 93 92 96
3 90 88 77
4 80 90 90
'''
print df1
print('------------------')
'''
The following is df2 Return result of :
English Math Chinese
ZhangSan 65 30 66
LiSi 85 98 95
WangWu 92 96 93
XiaoMing 88 77 90
LiHua 90 90 80
'''
print df2
2,DataFrame Basic properties of
df.shape # Row number , Number of columns
df.dtypes # Column data type
df.ndim # Data dimension
df.index # Row index
df.columns # Column index
df.values # The object is worth , A two-dimensional ndarray Array
df.head(3) # Show the first few lines , The default is 5 That's ok
df.tail(3) # Show last lines , The default is 5 That's ok
df.info() # Overview of relevant information
df.describe() # Quick synthesis of Statistics
3、 ... and , Data processing
1, Data import and output
Pandas Allow direct access from json,txt,xlsx,csv And so on , It can also be output to json,txt,xlsx,csv Wait for the documents , Very convenient .
import pandas as pd
from pandas import Series, DataFrame
# Reading and writing xlsx File format
score = DataFrame(pd.read_excel('data.xlsx'))
score.to_excel('data1.xlsx')
# Reading and writing json File format
data=DataFrame(pd.read_json('data.json'))
data.to_json('another_data.json')
# Reading and writing csv File format
data2=DataFrame(pd.read_csv('data.csv'))
data2.to_csv('another_data.csv')
# Reading and writing txt File format
data3=DataFrame(pd.read_hdf('./data.txt'))
data3.to_hdf('./another_data.txt')
2, Delete DataFrame Unnecessary columns or rows in
2.1, Delete a column
data = {'Chinese': [66, 95, 93, 90, 80], 'English': [65, 85, 92, 88, 90], 'Math': [30, 98, 96, 77, 90]}
df2 = DataFrame(data=data, index=['ZhangSan', 'LiSi', 'WangWu', 'XiaoMing', 'LiHua'],
columns=['English', 'Math', 'Chinese'])
'''
df2 Is as follows :
English Math Chinese
ZhangSan 65 30 66
LiSi 85 98 95
WangWu 92 96 93
XiaoMing 88 77 90
LiHua 90 90 80
'''
# Delete 'Chinese' This column
df2 = df2.drop(columns=['Chinese'])
'''
The operation results are as follows ;
English Math
ZhangSan 65 30
LiSi 85 98
WangWu 92 96
XiaoMing 88 77
LiHua 90 90
'''
print df2
2.2, Delete a line
data = {'Chinese': [66, 95, 93, 90, 80], 'English': [65, 85, 92, 88, 90], 'Math': [30, 98, 96, 77, 90]}
df2 = DataFrame(data=data, index=['ZhangSan', 'LiSi', 'WangWu', 'XiaoMing', 'LiHua'],
columns=['English', 'Math', 'Chinese'])
'''
df2 Is as follows :
English Math Chinese
ZhangSan 65 30 66
LiSi 85 98 95
WangWu 92 96 93
XiaoMing 88 77 90
LiHua 90 90 80
'''
# Delete 'ZhangSan' This business
df2=df2.drop(index=['ZhangSan'])
'''
The operation results are as follows ;
English Math
ZhangSan 65 30
LiSi 85 98
WangWu 92 96
XiaoMing 88 77
LiHua 90 90
'''
print df2
3, Rename column name columns perhaps Row index index, Make list names or row names easier to identify
data = {'Chinese': [66, 95, 93, 90, 80], 'English': [65, 85, 92, 88, 90], 'Math': [30, 98, 96, 77, 90]}
df2 = DataFrame(data=data, index=['ZhangSan', 'LiSi', 'WangWu', 'XiaoMing', 'LiHua'],
columns=['English', 'Math', 'Chinese'])
'''
df2 Is as follows :
English Math Chinese
ZhangSan 65 30 66
LiSi 85 98 95
WangWu 92 96 93
XiaoMing 88 77 90
LiHua 90 90 80
'''
df2.rename(columns={'Chinese': ' Chinese language and literature ', 'English': ' English ','Math':' mathematics '}, inplace=True)
df2.rename(index={'ZhangSan': ' Zhang San '},inplace=True)
'''
The operation results are as follows ;
English mathematics Chinese language and literature
Zhang San 65 30 66
LiSi 85 98 95
WangWu 92 96 93
XiaoMing 88 77 90
LiHua 90 90 80
'''
print df2
4, To repeat the value of
data = {'Chinese': [66, 95, 93, 90, 80,80], 'English': [65, 85, 92, 88, 90,90], 'Math': [30, 98, 96, 77, 90,90]}
df2 = DataFrame(data=data, index=['ZhangSan', 'LiSi', 'WangWu', 'XiaoMing', 'LiHua','LiHua'],
columns=['English', 'Math', 'Chinese'])
'''
df2 Is as follows :
English Math Chinese
ZhangSan 65 30 66
LiSi 85 98 95
WangWu 92 96 93
XiaoMing 88 77 90
LiHua 90 90 80
LiHua 90 90 80
'''
# Remove duplicate lines
df2 = df2.drop_duplicates()
'''
The operation results are as follows ;
English Math Chinese
ZhangSan 65 30 66
LiSi 85 98 95
WangWu 92 96 93
XiaoMing 88 77 90
LiHua 90 90 80
'''
print df2
5, Change data format
have access to astype Function to format data , That is, converting data types
data = {'Chinese': [66, 95, 93, 90, 80,80], 'English': [65, 85, 92, 88, 90,90], 'Math': [30, 98, 96, 77, 90,90]}
df2 = DataFrame(data=data, index=['ZhangSan', 'LiSi', 'WangWu', 'XiaoMing', 'LiHua','LiHua'],
columns=['English', 'Math', 'Chinese'])
'''
df2 Is as follows :
English Math Chinese
ZhangSan 65 30 66
LiSi 85 98 95
WangWu 92 96 93
XiaoMing 88 77 90
LiHua 90 90 80
LiHua 90 90 80
'''
df2[['Math']].astype('str')
df2[['Math']].astype(np.float)
'''
The operation results are as follows ;
English Math Chinese
ZhangSan 65 30 66
LiSi 85 98 95
WangWu 92 96 93
XiaoMing 88 77 90
LiHua 90 90 80
'''
print df2
6, Space between data
data = {'Chinese': [66, 95, 93, 90, 80,80], 'English': [65, 85, 92, 88, 90,90], 'Math': [30, 98, 96, 77, 90,90],'address':['Beijing','Chendu','Xian','Shanghai','Beijing','Beijing']}
df2 = DataFrame(data=data, index=['ZhangSan', 'LiSi', 'WangWu', 'XiaoMing', 'LiHua','LiHua'],
columns=['English', 'Math', 'Chinese','address'])
'''
df2 Is as follows :
English Math Chinese address
ZhangSan 65 30 66 Beijing
LiSi 85 98 95 Chendu
WangWu 92 96 93 Xian
XiaoMing 88 77 90 Shanghai
LiHua 90 90 80 Beijing
LiHua 90 90 80 Beijing
'''
# Delete the left and right spaces
df2['address'] = df2['address'].map(str.strip)
# Delete the left space
df2['address'] = df2['address'].map(str.lstrip)
# Delete the space on the right
df2['address'] = df2['address'].map(str.rstrip)
'''
The operation results are as follows ;
English Math Chinese address
ZhangSan 65 30 66 Beijing
LiSi 85 98 95 Chendu
WangWu 92 96 93 Xian
XiaoMing 88 77 90 Shanghai
LiHua 90 90 80 Beijing
LiHua 90 90 80 Beijing
'''
print df2
7, Remove special characters
data = {'Chinese': [66, 95, 93, 90, 80,80], 'English': [65, 85, 92, 88, 90,90], 'Math': [30, 98, 96, 77, 90,90],'address':['Beijing','Chendu#','Xian','Shanghai#','Beijing','Beijing']}
df2 = DataFrame(data=data, index=['ZhangSan', 'LiSi', 'WangWu', 'XiaoMing', 'LiHua','LiHua'],
columns=['English', 'Math', 'Chinese','address'])
'''
df2 Is as follows :
English Math Chinese address
ZhangSan 65 30 66 Beijing
LiSi 85 98 95 Chendu#
WangWu 92 96 93 Xian
XiaoMing 88 77 90 Shanghai#
LiHua 90 90 80 Beijing
LiHua 90 90 80 Beijing
'''
print df2
# Delete '#'
df2['address'] = df2['address'].str.strip('#')
'''
The operation results are as follows ;
English Math Chinese address
ZhangSan 65 30 66 Beijing
LiSi 85 98 95 Chendu
WangWu 92 96 93 Xian
XiaoMing 88 77 90 Shanghai
LiHua 90 90 80 Beijing
LiHua 90 90 80 Beijing
'''
print df2
8, Some columns are converted to uppercase , Lowercase or capital letters
data = {'Chinese': [66, 95, 93, 90, 80,80], 'English': [65, 85, 92, 88, 90,90], 'Math': [30, 98, 96, 77, 90,90],'address':['Beijing','Chendu#','Xian','Shanghai#','Beijing','Beijing']}
df2 = DataFrame(data=data, index=['ZhangSan', 'LiSi', 'WangWu', 'XiaoMing', 'LiHua','LiHua'],
columns=['English', 'Math', 'Chinese','address'])
'''
df2 Is as follows :
English Math Chinese address
ZhangSan 65 30 66 Beijing
LiSi 85 98 95 Chendu#
WangWu 92 96 93 Xian
XiaoMing 88 77 90 Shanghai#
LiHua 90 90 80 Beijing
LiHua 90 90 80 Beijing
'''
print df2
# Column 'address' Convert to uppercase
df2['address'] = df2['address'].str.upper()
# Column 'address' Convert to lowercase
# df2['address'] = df2['address'].str.lower()
# Column 'address' Convert the initial to uppercase
# df2['address'] = df2['address'].str.title()
'''
The operation results are as follows ;
English Math Chinese address
ZhangSan 65 30 66 BEIJING
LiSi 85 98 95 CHENDU#
WangWu 92 96 93 XIAN
XiaoMing 88 77 90 SHANGHAI#
LiHua 90 90 80 BEIJING
LiHua 90 90 80 BEIJING
'''
print df2
9, Find null values , Fill in empty values , Delete null :
data = {'Chinese': [66, 95, 93, 90, 80, np.nan], 'English': [65, 85, 92, 88, 90, np.nan],
'Math': [30, 98, 96, 77, 90, 90],
'address': ['Beijing', 'Chendu#', 'Xian', 'Shanghai#', 'Beijing', 'Beijing']}
df2 = DataFrame(data=data, index=['ZhangSan', 'LiSi', 'WangWu', 'XiaoMing', 'LiHua', 'LiHua'],
columns=['English', 'Math', 'Chinese', 'address'])
'''
df2 Is as follows :
English Math Chinese address
ZhangSan 65.0 30 66.0 Beijing
LiSi 85.0 98 95.0 Chendu#
WangWu 92.0 96 93.0 Xian
XiaoMing 88.0 77 90.0 Shanghai#
LiHua 90.0 90 80.0 Beijing
LiHua NaN 90 NaN Beijing
'''
print df2
# 1, Judge whether there is NANN The situation of , In this way :df2.isna() perhaps pd.isna(df2); df2.notna() perhaps pd.notna(df2) tips:isnull yes isna Another name for
'''
The operation results are as follows :
English Math Chinese address
ZhangSan False False False False
LiSi False False False False
WangWu False False False False
XiaoMing False False False False
LiHua False False False False
LiHua False False False False
'''
print df2.isna()
# 2, Determine which column in the data has a null value
'''
The operation results are as follows :
English False
Math False
Chinese False
address False
dtype: bool
'''
print df2.isna().any()
# 3, Encountered in the whole data nap Just replace it with 0
df2 = df2.fillna(0)
'''
The operation results are as follows :
English Math Chinese address
ZhangSan 65.0 30 66.0 Beijing
LiSi 85.0 98 95.0 Chendu#
WangWu 92.0 96 93.0 Xian
XiaoMing 88.0 77 90.0 Shanghai#
LiHua 90.0 90 80.0 Beijing
LiHua 0.0 90 0.0 Beijing
'''
print df2
# 4, Use the average value to fill in the empty value
df2.fillna(df2.mean())
# 5, Fill in the null with the median
df2.fillna(df2.median())
# 6, discarded ‘English’ and ‘Chinese’ Rows with missing values in these two columns
df2.dropna(axis=0, subset=["English", "Chinese"])
# 7, Discard the columns with all null values
data.dropna(axis=1, how="all")
# 8, Discard columns with missing values ( It's not usually done , This will delete a feature )
data.dropna(axis=1)
# 9, Only those rows with null values are discarded
data.dropna(how='all')
10, Use apply Function to process data :
data = {'Chinese': [66, 95, 93, 90, 80, np.nan], 'English': [65, 85, 92, 88, 90, np.nan],
'Math': [30, 98, 96, 77, 90, 90],
'address': ['Beijing', 'Chendu#', 'Xian', 'Shanghai#', 'Beijing', 'Beijing']}
df2 = DataFrame(data=data, index=['ZhangSan', 'LiSi', 'WangWu', 'XiaoMing', 'LiHua', 'LiHua'],
columns=['English', 'Math', 'Chinese', 'address'])
'''
df2 Is as follows :
English Math Chinese address
ZhangSan 65.0 30 66.0 Beijing
LiSi 85.0 98 95.0 Chendu#
WangWu 92.0 96 93.0 Xian
XiaoMing 88.0 77 90.0 Shanghai#
LiHua 90.0 90 80.0 Beijing
LiHua NaN 90 NaN Beijing
'''
print df2
# Yes address Columns are capitalized
df2['address'] = df2['address'].apply(str.upper)
'''
The following is the running result :
English Math Chinese address
ZhangSan 65.0 30 66.0 BEIJING
LiSi 85.0 98 95.0 CHENDU#
WangWu 92.0 96 93.0 XIAN
XiaoMing 88.0 77 90.0 SHANGHAI#
LiHua 90.0 90 80.0 BEIJING
LiHua NaN 90 NaN BEIJING
'''
print df2
11, Use apply Function to perform complex processing of data :
def plus(df, n, m):
df['another1'] = (df[u'Chinese'] + df[u'English']) * m
df['another2'] = (df[u'Chinese'] + df[u'English']) * n
return df
def method3():
data = {'Chinese': [66, 95, 93, 90, 80, np.nan], 'English': [65, 85, 92, 88, 90, np.nan],
'Math': [30, 98, 96, 77, 90, 90],
'address': ['Beijing', 'Chendu#', 'Xian', 'Shanghai#', 'Beijing', 'Beijing']}
df2 = DataFrame(data=data, index=['ZhangSan', 'LiSi', 'WangWu', 'XiaoMing', 'LiHua', 'LiHua'],
columns=['English', 'Math', 'Chinese', 'address'])
'''
df2 Is as follows :
English Math Chinese address
ZhangSan 65.0 30 66.0 Beijing
LiSi 85.0 98 95.0 Chendu#
WangWu 92.0 96 93.0 Xian
XiaoMing 88.0 77 90.0 Shanghai#
LiHua 90.0 90 80.0 Beijing
LiHua NaN 90 NaN Beijing
'''
print df2
# apply Call a function plus, Operate according to the column as axis (axis=1),args Pass on plus Two parameters required .
df2 = df2.apply(plus, axis=1, args=(2, 3,))
'''
The following is the running result :
English Math Chinese address another1 another2
ZhangSan 65.0 30 66.0 Beijing 393.0 262.0
LiSi 85.0 98 95.0 Chendu# 540.0 360.0
WangWu 92.0 96 93.0 Xian 555.0 370.0
XiaoMing 88.0 77 90.0 Shanghai# 534.0 356.0
LiHua 90.0 90 80.0 Beijing 510.0 340.0
LiHua NaN 90 NaN Beijing NaN NaN
'''
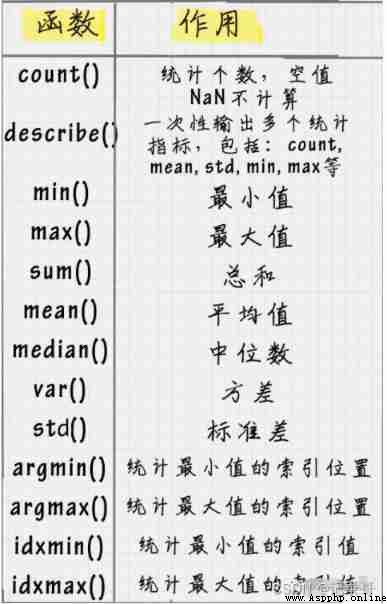
print df212, Functions related to data statistics :
13, Data table merging
df1 = DataFrame({'name': ['joel', 'ziwen', 'a', 'b', 'c'], 'data1': range(5)})
df2 = DataFrame({'name': ['joel', 'ziwen', 'A', 'B', 'C'], 'data2': range(5)})
# 1. Join based on specified columns
df3 = pd.merge(df1, df2, on='name')
'''
The operation results are as follows :
data1 name data2
0 0 joel 0
1 1 ziwen 1
'''
print df3
# 2,inner Internal connection
df4 = pd.merge(df1, df2, how='inner')
'''
The operation results are as follows :
data1 name data2
0 0 joel 0
1 1 ziwen 1
'''
print df4
# 3,left Left connection
df5 = pd.merge(df1, df2, how='left')
'''
The following is the running result :
data1 name data2
0 0 joel 0.0
1 1 ziwen 1.0
2 2 a NaN
3 3 b NaN
4 4 c NaN
'''
print df5
# 4,right The right connection
df6 = pd.merge(df1, df2, how='right')
'''
data1 name data2
0 0.0 joel 0
1 1.0 ziwen 1
2 NaN A 2
3 NaN B 3
4 NaN C 4
'''
print df6
# 5,outer External connection
df7 = pd.merge(df1, df2, how='outer')
'''
data1 name data2
0 0.0 joel 0.0
1 1.0 ziwen 1.0
2 2.0 a NaN
3 3.0 b NaN
4 4.0 c NaN
5 NaN A 2.0
6 NaN B 3.0
7 NaN C 4.0
'''
print df7
14,df.loc Index by tag ( Row index and column index ) Get row data
t = pd.DataFrame(np.arange(12).reshape((3, 4)), index=list(string.ascii_uppercase[:3]),
columns=list(string.ascii_uppercase[-4:]))
'''
t The output of is :
W X Y Z
A 0 1 2 3
B 4 5 6 7
C 8 9 10 11
'''
print t
tmp = t[:-1][['W', 'Z']]
'''
1, Simple and rough values :
W Z
A 0 3
B 4 7
'''
print tmp
# 2, Get row data by column name
print t.loc['A', 'W'] # The result is :0
# 3,'A' That's ok , Multiple columns of data
'''
give the result as follows :
W 0
Z 3
'''
print t.loc['A', ['W', 'Z']]
# 4, Multiple rows and columns
'''
W X
A 0 1
B 4 5
'''
print t.loc[['A', 'B'], ['W', 'X']]
# 5, Multiple rows and columns , Be careful The colon connects a closed interval
'''
W X Y Z
A 0 1 2 3
B 4 5 6 7
C 8 9 10 11
'''
print t.loc['A':'C', 'W':'Z']
15,df.iloc, Get row data by sequence number
t = pd.DataFrame(np.arange(12).reshape((3, 4)), index=list(string.ascii_uppercase[:3]),
columns=list(string.ascii_uppercase[-4:]))
'''
t The output of is :
W X Y Z
A 0 1 2 3
B 4 5 6 7
C 8 9 10 11
'''
print t
# 1, Get multi row and multi column data ,1:3 Note that this is a left closed right open section
'''
give the result as follows :
Y Z
B 6 7
C 10 11
'''
print t.iloc[1:3, [2, 3]]
# 2, Multiple rows and columns , The following two 1:3 All are left closed and right open intervals
'''
W X
A 0 1
B 4 5
'''
print t.iloc[1:3, 1:3]
# 3, Modifying data
'''
W X Y Z
A 0 1 100 3
B 4 5 6 7
C 8 9 10 11
'''
t.loc['A', 'Y'] = 100
print t
16,pandas Boolean index
data = {"Row_Labels": ['BELLS', 'CHARLIE', 'LUCKY', 'ROCKY', 'E', 'M'],
"Count_AnimalName": [1195, 856, 723, 823, 100, 20]}
t = pd.DataFrame(data=data, index=list([1156, 2660, 8552, 12368, 11, 12]))
'''
t The content of :
Count_AnimalName Row_Labels
1156 1195 BELLS
2660 856 CHARLIE
8552 723 LUCKY
12368 823 ROCKY
11 100 E
12 20 M
'''
print t
t = t[(t['Row_Labels'].str.len() > 2) & (t['Count_AnimalName'] > 700)]
'''
The result returned :
Count_AnimalName Row_Labels
1156 1195 BELLS
2660 856 CHARLIE
8552 723 LUCKY
12368 823 ROCKY
'''
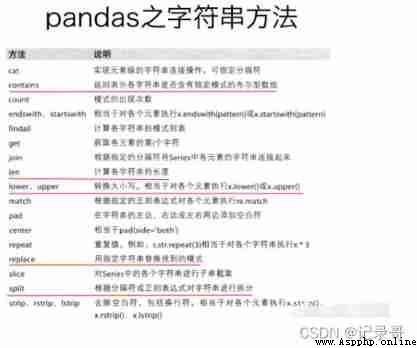
print t17,pandas String