Bin splitting is a common data preprocessing technology, which is sometimes called bucket splitting or discretization , It can be used to group the intervals of continuous data into “ box ” or “ bucket ” in . In this paper , We will discuss the use of python Pandas The library divides the values into boxes 4 Methods .
Let's create the following composite data to demonstrate
import pandas as pd # version 1.3.5
import numpy as np
def create_df():
df = pd.DataFrame({'score': np.random.randint(0,101,1000)})
return df
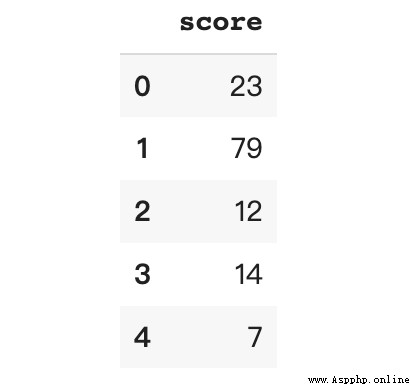
create_df()
df.head()The data includes 1000 Students 0 To 100 The test score of points . The task this time is to divide the numerical score into values “A”、“B” and “C” Level of , among “A” Is the best grade ,“C” Is the worst grade .
Pandas .between Method returns a containing True Boolean vector of , Used to correspond to Series The element is at the boundary value left and right Between .
The parameters have the following three :
left: Left boundary
right: Right border
inclusive: Which boundary to include . The acceptable value is {“both”、“neither”、“left”、“right”}.
Students are graded according to the following spacing rules :
A: (80, 100]
B: (50, 80]
C: [0, 50]
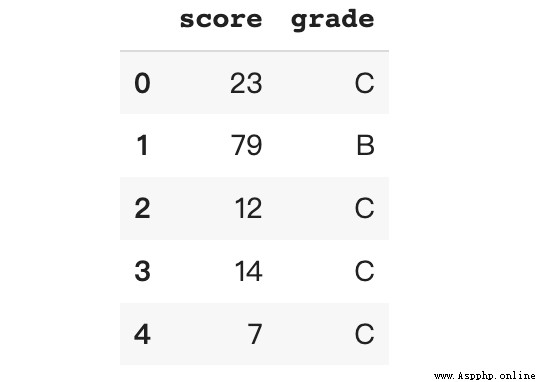
The square brackets [ Parentheses ) Indicates that the boundary value is included and excluded respectively . We need to determine which score is between the intervals of interest , And assign the corresponding level value . Note that the following different parameters indicate whether the boundary is included
df.loc[df['score'].between(0, 50, 'both'), 'grade'] = 'C'
df.loc[df['score'].between(50, 80, 'right'), 'grade'] = 'B'
df.loc[df['score'].between(80, 100, 'right'), 'grade'] = 'A'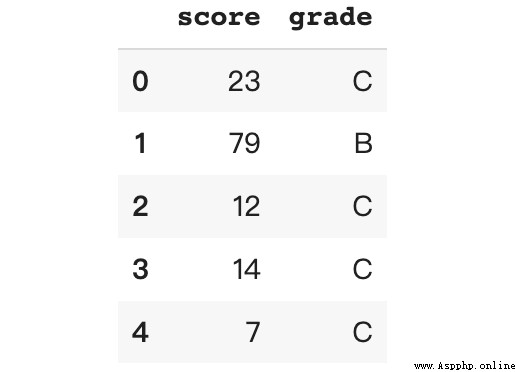
Here is the number of people in each score range :
df.grade.value_counts()C 488
B 310
A 202
Name: grade, dtype: int64This method needs to be used for each bin Write code for processing , Therefore, it only applies to bin In rare cases .
have access to cut Classify values into discrete intervals . This function is also useful for moving from continuous variables to categorical variables .
cut The parameters of are as follows :
x: The array to be boxed . Must be one-dimensional .
bins: Scalar sequence : Defines the allowable non-uniform width bin edge .
labels: Specify the returned bin The label of . It has to do with bins Same parameter length .
include_lowest: (bool) Whether the first interval should be left contained .
bins = [0, 50, 80, 100]
labels = ['C', 'B', 'A']
df['grade'] = pd.cut(x = df['score'],
                      bins = bins,
                      labels = labels,
                      include_lowest = True)
This creates a file that contains bin Boundary value bins The list and one contain the corresponding bin Tag list of tags .
View the number of people in each section
df.grade.value_counts()C 488
B 310
A 202
Name: grade, dtype: int64The result is the same as the above example .
qcut Variables can be discretized into buckets of equal size according to ranking or based on sample quantiles [3].
In the previous example , We defined the score interval for each level , This makes the number of students at each level uneven . In the following example , We will try to classify students as 3 Two have equal ( about ) Score grade of quantity . Examples include 1000 Famous student , Therefore, each sub box should have about 333 Famous student .
qcut Parameters :
x: Input array to be boxed . Must be one-dimensional .
q: quantile .10 Represents the decile ,4 Indicates the quartile, etc . It can also be alternatively arranged quantiles , for example [0, .25, .5, .75, 1.] Four percentile .
labels: Appoint bin The label of . Must be consistent with the generated bin Same length .
retbins: (bool) Whether to return (bins, labels).
df['grade'], cut_bin = pd.qcut(df['score'],
                          q = 3,
                          labels = ['C', 'B', 'A'],
                          retbins = True)
df.head()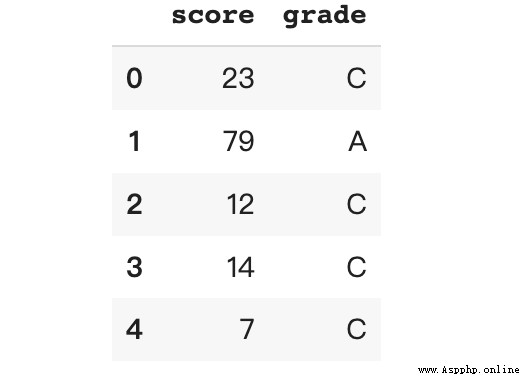
If retbins Set to True Will return bin The border .
print (cut_bin)
>> [  0.  36.  68. 100.]
The score interval is as follows :
C:[0, 36]
B:(36, 68]
A:(68, 100]
Use .value_counts() Check how many students there are at each level . Ideally , Each box should have about 333 Famous student .
df.grade.value_counts()C 340
A 331
B 329
Name: grade, dtype: int64although pandas .value_counts Usually used to calculate the number of unique values in a series , But it can also be used bins Parameters group values into half boxes .
df['score'].value_counts(bins = 3, sort = False)By default , .value_counts Sort the returned Series in descending order of values . take sort Set to False Sort the series in ascending order of their index .
(-0.101, 33.333] 310
(33.333, 66.667] 340
(66.667, 100.0] 350
Name: score, dtype: int64
series Index refers to each bin Range of , The square brackets [ Parentheses ) Indicates that the boundary value is included and excluded respectively . return series The value of represents each bin How many records are there in .
And .qcut Different , Every bin The number of records in is not necessarily the same ( about )..value_counts The same number of records will not be assigned to the same category , Instead, the score range is divided into... According to the highest and lowest scores 3 An equal part . The minimum value of the score is 0, The maximum value is 100, So this 3 Each of the three parts is about 33.33 Within the scope of . It also explains why bin The boundary of this is 33.33 Multiple .
We can also define by passing in the boundary list bin The border .
df['score'].value_counts(bins = [0,50,80,100], sort = False)(-0.001, 50.0] 488
(50.0, 80.0] 310
(80.0, 100.0] 202
Name: score, dtype: int64This gives us examples 1 and 2 Same result .
In this paper , How to use .between、.cut、.qcut and .value_counts Box the continuous values . Here is the source code of this article :
[1]
source : https://colab.research.google.com/drive/1yWTl2OzOnxG0jCdmeIN8nV1MoX3KQQ_1%3Fusp%3Dsharing

Long press attention - About data analysis and visualization - Set to star , Dry goods express
NO.1
Previous recommendation
Historical articles
New generation reptile weapon — Playwright
Use LSTM Forecast sales (Python Code )
Python Handle PDF Artifact :PyMuPDF Installation and use of
Decision tree 、 Random forests 、bagging、boosting、Adaboost、GBDT、XGBoost summary
Share 、 Collection 、 give the thumbs-up 、 I'm looking at the arrangement ?