In the last article, I shared some methods about data missing value processing , Links are as follows : [【Python Basis of data analysis 】: Data missing value processing
This article continues to share another common problem in data cleaning : Outlier detection and processing .
In machine learning , Anomaly detection and handling It's a smaller branch , Or say , Is a by-product of machine learning , Because in general prediction problems , A model is usually an expression of the overall sample data structure , This expression usually captures the general nature of the overall sample , And those points that are completely inconsistent with the overall sample in these properties , We call it an outlier , Usually outliers are not popular with developers in prediction problems , Because the prediction problem is concerned with the nature of the overall sample , The generation mechanism of outliers is completely inconsistent with the overall sample , If the algorithm is sensitive to outliers , Then the generated model can not have a better expression for the overall sample , So the prediction will be inaccurate . On the other hand , In some cases, outliers are of great interest to analysts , Such as disease prediction , Generally, the physical indicators of healthy people are similar in some dimensions , If a person's physical indicators are abnormal , Then his physical condition must have changed in some ways , Of course, this change is not necessarily caused by disease ( It is often called noise point ), However, the occurrence and detection of abnormalities is an important starting point for disease prediction . Similar scenarios can also be applied to credit fraud , Cyber attacks and so on .
Generally, the detection methods of outliers are based on statistics , Clustering based methods , And some special methods for detecting outliers , These methods are introduced below .
If you use pandas, We can use it directly describe() To observe the statistical description of the data ( Just a rough observation of some statistics ), But the statistics are continuous , as follows :
df.describe()
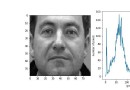
Or the existence of outliers can be clearly observed by simply using the scatter diagram . As shown below :
This principle has a condition : The data needs to obey the normal distribution . stay 3∂ In principle , If the abnormal value exceeds 3 Times the standard deviation , Then you can treat it as an outlier . Plus or minus 3∂ Is the probability that 99.7%, So the average distance 3∂ The probability of occurrence of values other than P(|x-u| > 3∂) <= 0.003, It belongs to a very small probability event . If the data does not obey the normal distribution , It can also be described by how many times the standard deviation away from the average .
The red arrow indicates an outlier .
This method is based on box diagram Four minute spacing (IQR) Detect outliers , Also called Tukey‘s test. The definition of box diagram is as follows :
Four minute spacing (IQR) Is the difference between the upper quartile and the lower quartile . And we passed IQR Of 1.5 Times the standard , Regulations : exceed The top quartile +1.5 times IQR distance , Or the lower quartile -1.5 times IQR distance The point of is the outlier . Here is Python Code implementation in , Mainly used numpy Of percentile Method .
Percentile = np.percentile(df['length'],[0,25,50,75,100])
IQR = Percentile[3] - Percentile[1]
UpLimit = Percentile[3]+ageIQR*1.5
DownLimit = Percentile[1]-ageIQR*1.5
You can also use seaborn Visualization method of boxplot To achieve :
f,ax=plt.subplots(figsize=(10,8))
sns.boxplot(y='length',data=df,ax=ax)
plt.show()
The red arrow indicates an outlier .
The above is a simple method commonly used to judge outliers . Let's introduce some complex outlier detection algorithms , Because it involves a lot of content , Just introduce the core idea , Interested friends can study deeply by themselves .
This method usually builds a Probability distribution model , And calculate the probability that the object conforms to the model , Treat objects with low probability as outliers . If the model is a collection of clusters , Then the exception is an object that does not significantly belong to any cluster ; If the model is regression , Anomalies are objects that are relatively far away from the predicted value .
Probability definition of outliers : An outlier is an object , About the probability distribution model of data , It has a low probability . The premise of this situation is to know what distribution the data set obeys , If the estimation is wrong, it will result in a heavy tailed distribution .
For example, in feature engineering RobustScaler Method , When scaling data eigenvalues , It takes advantage of the quantile distribution of data features , Divide the data into segments based on quantiles , Just take the middle segment to zoom , For example, just take 25% Quantile to 75% Scale the quantile data . This reduces the impact of abnormal data .
Advantages and disadvantages :(1) Have a solid theoretical foundation of Statistics , When there is sufficient data and knowledge of the type of test used , These tests can be very effective ;(2) For multivariate data , There are fewer options available , And for high-dimensional data , These tests are very unlikely .
Statistical method is to use the distribution of data to observe outliers , Some methods even require some distribution conditions , In practice, the distribution of data is difficult to meet some assumptions , There are certain limitations in use .
It is easier to determine the meaningful proximity measure of a data set than its statistical distribution . This method is more general than statistical methods 、 Easier to use , because An object's outlier scores from its k- Nearest neighbor (KNN) Given the distance .
It should be noted that : Outlier score pair k The value of is highly sensitive . If k Too small , Then a small number of adjacent outliers may lead to lower outlier scores ; If K Too big , The number of points is less than k All objects in the cluster may become outliers . In order to make the scheme suitable for k The selection of is more robust , have access to k The average distance of the nearest neighbors .
Advantages and disadvantages :(1) Simple ;(2) shortcoming : Proximity based methods require O(m2) Time , Large data sets are not applicable ;(3) This method is also sensitive to the selection of parameters ;(4) Data sets with different density areas cannot be processed , Use the global threshold because it , This change in density cannot be considered .
From a density based point of view , Outliers are objects in low-density areas . Density based outlier detection is closely related to proximity based outlier detection , Because density is usually defined by proximity . A common way to define density is , Define the density as to k The reciprocal of the average distance of the nearest neighbors . If the distance is small , The density is high , vice versa . Another definition of density is Use DBSCAN The density definition used by the clustering algorithm , That is, the density around an object is equal to the specified distance of the object d Number of objects in .
Advantages and disadvantages :(1) The quantitative measure that the object is an outlier is given , And even if the data has different areas, it can be handled well ;(2) Same as the distance based method , These methods must have O(m2) Time complexity of . For low dimensional data, using a specific data structure can achieve O(mlogm);(3) Parameter selection is difficult . although LOF The algorithm observes different k value , Then get the maximum outlier score to deal with the problem , however , You still need to choose the upper and lower bounds of these values .
Outliers based on clustering : An object is an outlier based on clustering , If the object does not strongly belong to any cluster , Then the object belongs to outlier .
The influence of outliers on initial clustering : If outliers are detected by clustering , The clustering is affected by outliers , There is a problem : Whether the structure is effective . This is also k-means Disadvantages of the algorithm , Sensitive to outliers . To deal with the problem , You can use the following methods : Object clustering , Delete outliers , Objects are clustered again ( This does not guarantee optimal results ).
Advantages and disadvantages :(1) Based on linear and near linear complexity (k mean value ) Clustering techniques to find outliers may be highly effective ;(2) The definition of cluster is usually the complement of outliers , Therefore, it is possible to find clusters and outliers at the same time ;(3) The resulting outlier sets and their scores may depend very much on the number of clusters used and the existence of outliers in the data ;(4) The quality of the clustering algorithm is greatly affected by the outliers .
In fact, the original intention of clustering method mentioned above is unsupervised classification , Not to find outliers , It just happens that its function can realize the detection of outliers , It's a derivative function .
In addition to the methods mentioned above , There are also two special methods for detecting outliers, which are commonly used :One Class SVM and Isolation Forest, The details are not studied in depth .
Outliers detected , We need to deal with it . The processing methods of general outliers can be roughly divided into the following :
Whether to delete outliers can be considered according to the actual situation . Because some models are not very sensitive to outliers , Even if there are outliers, it does not affect the effect of the model , But some models, such as logistic regression LR Sensitive to outliers , If not handled , There may be very poor effects such as fitting .
The above is a summary of outlier detection and processing methods .
Through some detection methods, we can find outliers , But the result is not absolutely correct , The specific situation needs to be judged according to the understanding of the business . Again , How to deal with outliers , It's time to delete , correct , It still needs to be considered in combination with the actual situation , There is no fixed .
In this paper, from https://juejin.cn/post/6844903653178867726, If there is any infringement , Please contact to delete .