(1)csv File format : To store data in a text file , The simplest way is to treat the data as a series of commas ( , ) Delimited values are written to the file 【 form : Between data , The number separated 】
# for example :2014-1-5,61,44,26,18,7,-1,56,30,9,30.34,30.27,30.15,10,4,0.00,0,195
(2) analysis csv The file header
#csv The processing module is contained in Python Standard library , Can be analyzed csv Data line of the file , You can quickly extract values of interest .
def read_csv2():
filename = 'D:\python_test1\chapter_16_sitka_weather_07-2014.csv' # File path
with open(filename) as f:# Open file , And create a file object
# Pass the file object as a parameter to csv.reader(), And create a reader instance associated with the file , Reader objects are stored in reader in
#reader Process the first row of data separated by commas in the file , And store each item of data as an element in the list
# The cursor is now at -1 The location of
reader = csv.reader(f)
# modular csv Include functions next(), When you call it and pass the reader object to it , It will return the next line in the file .
# from -1 OK, let's start , Every call , Get the next line .
header_row = next(reader)
#enumerate() Get the index of each element and its value
for index, column_header in enumerate(header_row):
print(index, column_header)
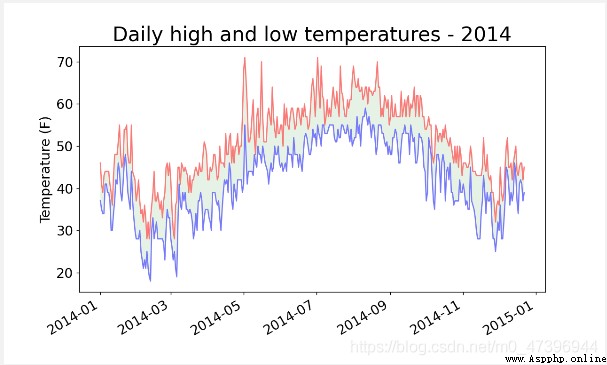
(3) Visual instance : Draw a weather map for the whole year
def get_allyear():
filename="D:\python_test1\chapter_16_sitka_weather_2014.csv"
with open(filename) as f:# Open file
# Create a csv File reader objects , The cursor of the current file is located at -1 It's about
reader=csv.reader(f)
# Move the cursor to the 1 That's ok
next(reader)
# Create a new list of stored information
highs,dates,lows=[]# maximum temperature 、 date 、 Minimum temperature
# Get the required data in the data set , And stored in the corresponding data set
# because csv Files store text character data , Therefore, the extracted data is also text data , If data processing is required , It should be converted to numerical data int() Cast
for row in reader:
# Maximum storage temperature
highs.append(int(row[1]))
# Date of storage
date=datetime.strptime(row[0],"%Y-%m-%d")
dates.append(date)
# Minimum storage temperature
lows.append(int(row[3]))
# Drawing graphics
# Set image size
fig=plt.figure(dpi=128,figsize=(10,6))
# drawing Two plot Draw on a picture
plt.plot(dates,highs,c="red",alpha=0.5)
plt.plot(dates,lows,c="blue",alpha=0.5)
# alpha Set opacity Alpha The value is 0 Indicates full transparency ,1( default setting ) Indicates full opacity By setting alpha Value to set the transparency of the line
#fill_between() Set the fill area , Actual parameters facecolor Specifies the color of the filled area dates indicate x Axis range , highs, lows Two y Axis range , from x Scope and y The area jointly constructed by the axis range is filled
# effect : Let the filled area connect the two data series without distracting the observer .
plt.fill_between(dates, highs, lows, facecolor='green', alpha=0.1)
# Set the corresponding label
plt.title("Daily high and low temperatures - 2014", fontsize=24)
plt.xlabel("",fontsize=16)
fig.autofmt_xdate() # Draw oblique date labels , So they don't overlap
plt.ylabel("Temperature (F)", fontsize=16)
# Set the scale mark size
plt.tick_params(axis='both', which='major', labelsize=16)
plt.show()
# If there is a missing value
# Then try:...except abnormal :... else: Format for exception capture
【 Key points & New knowledge 】:
(1) Set image size ( Custom image instances )
fig=plt.figure(dpi=128,figsize=(10,6))
grammar :
figure(num=None, figsize=None, dpi=None, facecolor=None,edgecolor=None, frameon=True)
Argument parsing :
num: Image number or name , Numbers are numbers , The string is the name
figsize: Appoint figure Width and height , In inches ;
dpi Parameters : Specifies the resolution of the drawing object , How many pixels per inch , The default value is 80
facecolor: The background color
edgecolor: Border color
frameon: Show border or not
Add :
fig.autofmt_xdate()# Draw oblique date labels , So they don't overlap
(2) Draw two lines in the same polyline
Grammatical logic : For the same plt Instance add data , Call several times plot function , You can draw multiple polylines in the same graph .
# drawing Two plot Draw on a picture
plt.plot(dates,highs,c=“red”,alpha=0.5)
plt.plot(dates,lows,c=“blue”,alpha=0.5)
#dates x Axis highs/lows y Axis alpha=0.5 Set opacity
(3) Set the image fill area
fill_between() Set the fill area
plt.fill_between(dates, highs, lows, facecolor=‘green’, alpha=0.1)
Argument parsing :
# Actual parameters facecolor Specifies the color of the filled area dates indicate x Axis range , highs, lows Two y Axis range , from x Scope and y The area jointly constructed by the axis range is filled
# effect : Let the filled area connect the two data series without distracting the observer .
【 Result analysis 】: