Catalog
Comprehensive evaluation method
What is? Topsis Law
MATLAB Code
TOPSIS Algorithm steps of method
Data forward
Data standardization
Consider whether to weight ?( Entropy weight method )
Normalize and calculate the score ( Unweighted )
The best and the worst ( weighting )
TOPSIS Evaluation of law
visualization
(AHP) Analytic hierarchy process legal weight
Every word
Evaluation methods are generally divided into two categories . One is Subjective weighting method , Most take Determine the weight based on the comprehensive consultation score , Such as : Composite index method 、 Fuzzy comprehensive evaluation method 、 Analytic hierarchy process 、 Efficiency coefficient method, etc . The other is objective weighting method , according to The correlation between each index or the variation degree of each index value To determine the weights , Such as : Principal component analysis 、 Factor analysis 、 Ideal solution, etc .
So far , The main evaluation methods used Yes : Principal component analysis 、 Factor analysis Law 、TOPSIS Law ( This article explains in detail )、 Rank sum ratio method 、 Grey correlation method 、 Entropy weight method 、 Analytic hierarchy process 、 Fuzzy evaluation method 、 Matter element analysis 、 Cluster analysis 、 Value Engineering 、 Neural network method, etc .
Do you feel too much , In fact, when you step into machine learning and algorithms , And the path of modeling , Knowledge is learning more , The more you learn, the more you learn . It is said that : Someone outside the person , behind , The ocean of knowledge is endless , No end for learning , Of course we have to make a boat , Otherwise, it has not entered the sea 3 Seconds you will be drowned , Ha ha ha !
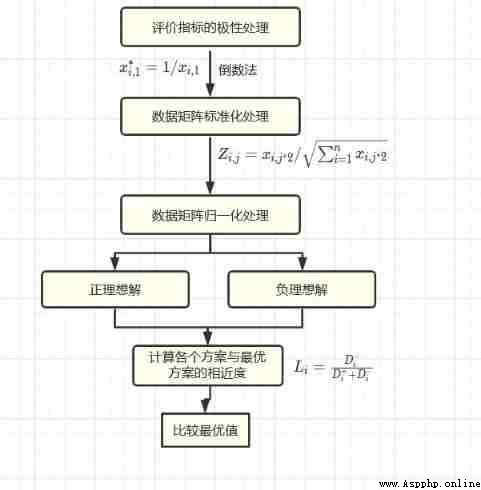
This method constructs the positive ideal solution and negative ideal solution of the evaluation problem ( The optimal solution and the worst solution of each index ), By calculating the relative closeness of each scheme to the ideal scheme , That is, the degree of approaching the positive ideal solution and the negative ideal solution , To sort the schemes , So as to select the best scheme .
TOPSIS Law It is a method of ranking according to the proximity of a limited number of evaluation objects to the idealized goal , It is to evaluate the relative advantages and disadvantages among the existing objects 【 Each index value of the optimal solution reaches the optimal value of each evaluation index , Each index value of the worst solution reaches the worst value of each evaluation index 】
TOPSIS Law It is especially suitable when there are multiple groups of evaluation objects , It is required to test the evaluation object and the optimal solution 、 The distance of the worst solution
Principle thought 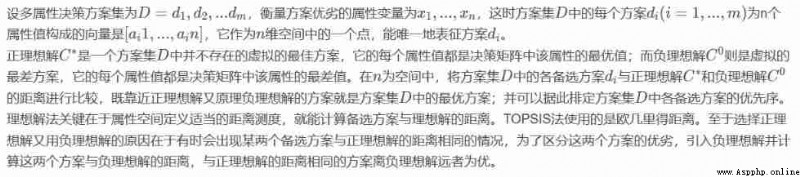
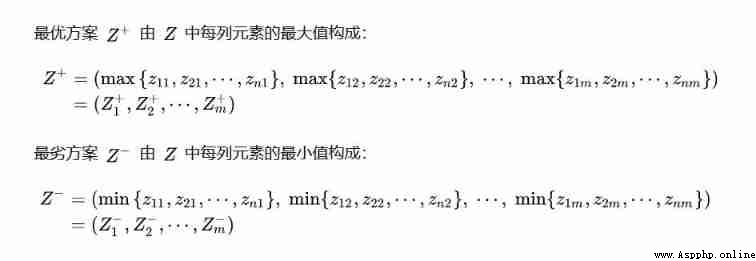
Determine the best plan and the worst plan
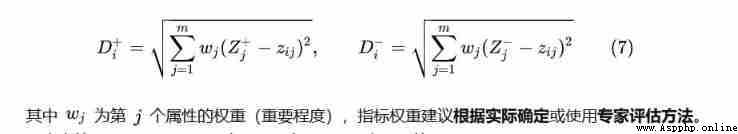
Calculate each evaluation object and the optimal scheme 、 The closeness of the worst case ( A typical : Entropy weight method )
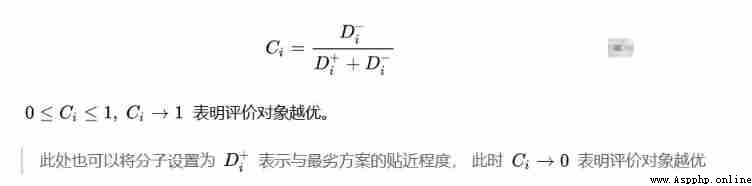
Calculate the degree of closeness between each evaluation object and the optimal scheme
Here's one MATLAB Code case , You can use , From entropy weight method to score , This article focuses on Python From the angle of .
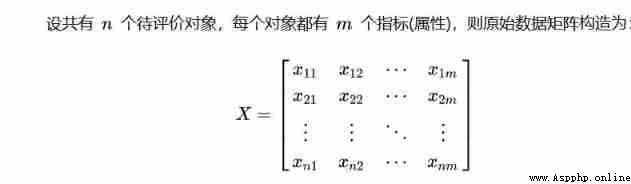
%% First step : Copy data to workspace , And name this matrix X
load data_water_quality.mat % The name of the data is data_water_quality
%% The second step : Determine whether you need to forward
[n,m] = size(X);
disp([' share ' num2str(n) ' Two evaluation objects , ' num2str(m) ' Evaluation indicators '])
Judge = input([' this ' num2str(m) ' Whether an indicator needs to be processed forward , Please enter 1 , No need to input 0: ']);
if Judge == 1
Position = input(' Please enter the column of the indicator that needs forward processing , For example 2、3、6 Three columns need to be handled , So you need to type in [2,3,6]: ');%[2,3,4]
disp(' Please enter the indicator type of these columns to be processed (1: Very small , 2: The middle type , 3: Interval type ) ')
Type = input(' for example : The first 2 Columns are very small , The first 3 Columns are interval type , The first 6 Columns are intermediate , enter [1,3,2]: '); % [2,1,3]
for i = 1 : size(Position,2)
X(:,Position(i)) = Positivization(X(:,Position(i)),Type(i),Position(i));
end
disp(' The forward matrix X = ')
disp(X)
end
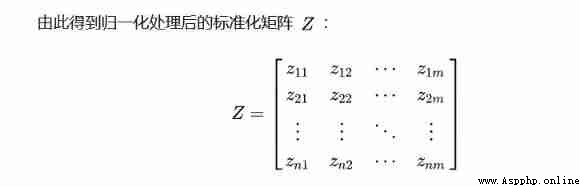
%% The third step : Normalize the forward matrix
Z = X ./ repmat(sum(X.*X) .^ 0.5, n, 1);
disp(' Standardized matrix Z = ')
disp(Z)
%% Step four : Let the user decide whether to increase the weight ( You can decide the weight yourself , The entropy weight method can also be used to determine the weight )
disp(" Please enter whether you need to increase the weight vector , Need to enter 1, No need to input 0")
Judge = input(' Please enter whether you need to increase the weight : ');
if Judge == 1
Judge = input(' To determine the weight using the entropy weight method, please enter 1, Otherwise input 0: ');
if Judge == 1
if sum(sum(Z<0)) >0 % If previously standardized Z There are negative numbers in the matrix , Then, we should renew our understanding of X Standardize
disp(' Originally standardized Z There are negative numbers in the matrix , So you need to X Re standardize ')
for i = 1:n
for j = 1:m
Z(i,j) = [X(i,j) - min(X(:,j))] / [max(X(:,j)) - min(X(:,j))];
end
end
disp('X The standardization matrix obtained by re standardization Z by : ')
disp(Z)
end
weight = Entropy_Method(Z);
disp(' The weight determined by entropy weight method is :')
disp(weight)
else
disp([' If you have 3 Indicators , You need to enter 3 A weight , For example, they are 0.25,0.25,0.5, Then you need to enter [0.25,0.25,0.5]']);
weight = input([' You need to type in ' num2str(m) ' Weights .' ' Please enter this as a line vector ' num2str(m) ' A weight : ']);
OK = 0; % Used to judge whether the user's input format is correct
while OK == 0
if abs(sum(weight) -1)<0.000001 && size(weight,1) == 1 && size(weight,2) == m % Note floating point numbers
OK =1;
else
weight = input(' There's something wrong with your input , Please re-enter the weight line vector : ');
end
end
end
else
weight = ones(1,m) ./ m ; % If you do not need to add weights, the default weights are the same , That is to say, all are 1/m
end
%% Step five : Calculate the distance from the maximum and the distance from the minimum , And calculate the score
D_P = sum([(Z - repmat(max(Z),n,1)) .^ 2 ] .* repmat(weight,n,1) ,2) .^ 0.5; % D+ The distance vector from the maximum
D_N = sum([(Z - repmat(min(Z),n,1)) .^ 2 ] .* repmat(weight,n,1) ,2) .^ 0.5; % D- The distance vector from the minimum
S = D_N ./ (D_P+D_N); % Non normalized score
disp(' The final score is :')
stand_S = S / sum(S)
[sorted_S,index] = sort(stand_S ,'descend')
① Forward ( Each column turns to very large )
② Standardization ( Each element is standardized )
③ normalization ( The sum of each column is 1 )
④ Calculate weight ( Find the sum of each line )
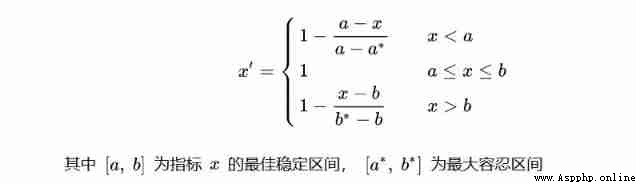
Some data are as big as possible , Some data is close to a certain value, the better , Some are the best in a range , This different direction and interval makes the analysis confusing , To simplify the analysis, we forward the data , Make him as old as possible . Generally speaking , Common data can be divided into four categories :
Very large indicators ( Benefit indicators ): The larger the index value, the better .
Very small index ( Cost index ): The smaller the index value, the better .
Intermediate indicators : The closer the index value is to a certain value, the better .
Interval index : The index value is the best in a certain range , There is no good or bad value in the interval .
Very small indicators are transformed into very large indicators :( Prevalence )
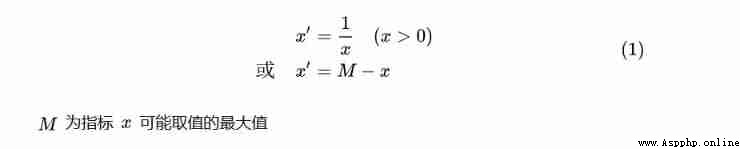
# Very small index -> Very large indicators
def dataDirection_1(datas):
return np.max(datas)-datas # A set of formulas (1)
Intermediate indicators are transformed into very large indicators :(ph The closer the value is. 7 The better )
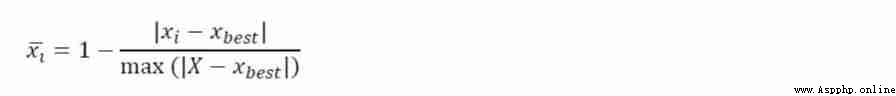
# Intermediate indicators -> Very large indicators
def dataDirection_2(datas, x_best):
temp_datas = datas - x_best
M = np.max(abs(temp_datas))
answer_datas = 1 - abs(datas - x_best) / M # A set of formulas
return answer_datas
Interval indicators are transformed into very large indicators : The value of expectation index is best to fall in a certain interval ( Such as body temperature )
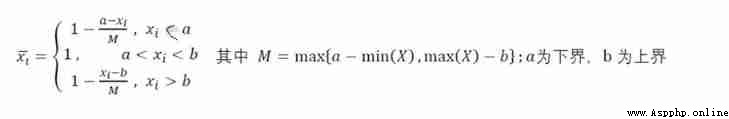
# Interval index -> Very large indicators
def dataDirection_3(datas, x_min, x_max):
M = max(x_min - np.min(datas), np.max(datas) - x_max)
answer_list = []
for i in datas:
if(i < x_min):
answer_list.append(1 - (x_min-i) /M) # A set of formulas
elif( x_min <= i <= x_max):
answer_list.append(1)
else:
answer_list.append(1 - (i - x_max)/M)
return np.array(answer_list)
So sometimes , We are not sure about the best interval value , Maybe we are under different experts or information , It is found that the interval value fluctuates , Let's take a simple example , Suppose a certain indicator is officially given as [4,5], But there will be a problem , In some cases 5.5 and 3.5 It's good , If the latter is adopted, it will be too extreme , It is too limited to adopt the former , So how should we do it ? Here we redefine a formula , Added Maximum tolerance interval .
def dataDirection_3(datas, x_min, x_max, x_minimum, x_maximum):
def normalization(data):
if data >= x_min and data <= x_max:
return 1
elif data <= x_minimum or data >= x_maximum:
return 0
elif data > x_max and data < x_maximum:
return 1 - (data - x_max) / (x_maximum - x_max)
elif data < x_min and data > x_minimum:
return 1 - (x_min - data) / (x_min - x_minimum)
return list(map(normalization, datas))
The above conversion , In fact, they are ultimately converted to positive values , Whatever your method is , All roads lead to Rome
After positive transformation , Another problem is All values have their dimensions , Take the table values that have been normalized as an example , If you calculate the distance directly , So it must be that the more vital people are, the healthier they are , For example, vital capacity is much larger than other values , In order to eliminate the influence of data dimension, we need to standardize the data . The method for standardizing the data of each column is as follows :
Construct weighted gauge matrix , Attribute to normalize the vector , That is, each column element is divided by the norm of the current column vector ( Use cosine distance measurement )

# Use sklearn The bag inside , Do not use traditional methods
from sklearn.preprocessing import MinMaxScaler,StandardScaler,scale
def temp2(A):
max_min_scaler=StandardScaler()
A=max_min_scaler.fit_transform(A)
return A
# This method is suitable for most types of data , It is widely used . We can see from the formula that , After the transformation, the mean value will become 0, And the variance and standard deviation will become 1( A formula considering variance ), If you don't understand this part, you might as well reason in the book .
Principle of essence :
data = data / np.sqrt((data ** 2).sum())other :
def Standard(datas):
K = np.power(np.sum(pow(datas,2),axis = 0),0.5)
for i in range(len(K)):
datas.iloc[: , i] = datas.iloc[: , i] / K[i]
return datas
Here, you can use customized standardized formulas , Write the original code , however sklearn Faster and simpler , Machine learning has just been updated in the early stage .
Entropy weight method It is an objective weighting method , In the specific use process , According to the dispersion of the data of each index , The entropy weight of each index is calculated by using information entropy , Then the entropy weight is modified according to each index , So as to obtain a more objective index weight .
If you have certain indicators , More expert knowledge verification , Then you can also calculate the weight index according to the algorithm , Make some minor adjustments by yourself , Maybe it works better .
# Entropy weight method, etc
def entropy(df):
# Returns the index of each sample
# Sample size , The number of indicators
n,m=np.shape(data0)
# One sample per line , One indicator per column
# Here is the normalization
maxium=np.max(data0,axis=0)
minium=np.min(data0,axis=0)
data= (data0-minium)*1.0/(maxium-minium)
## Computation first j Indicators , The first i The proportion of samples in this index
sumzb=np.sum(data,axis=0)
data=data/sumzb
# Yes ln0 Handle
a=data*1.0
a[np.where(data==0)]=0.0001
# # Calculate the entropy of each index
e=(-1.0/np.log(n))*np.sum(data*np.log(a),axis=0)
# # Calculate weight
w=(1-e)/np.sum(1-e)
# recodes=np.sum(data*w,axis=1)
return w
plt.figure(figsize=(10,8))
sns.barplot(recodes,df.columns, orient='h')def Score(sta_data):
z_max = np.amax(sta_data , axis=0)
z_min = np.amin(sta_data , axis=0)
# Calculate the distance between each sample point and the maximum value
tmpmaxdist = np.power(np.sum(np.power((z_max - sta_data) , 2) , axis = 1) , 0.5) # Distance per sample Z+ Distance of
tmpmindist = np.power(np.sum(np.power((z_min - sta_data) , 2) , axis = 1) , 0.5) # Distance per sample Z+ Distance of
score = tmpmindist / (tmpmindist + tmpmaxdist)
score = score / np.sum(score) # normalization
return scoreimport pandas as pd
import numpy as np
def topsis(data, weight=None):
# normalization
data = data / np.sqrt((data ** 2).sum())
# The best and worst solution
Z = pd.DataFrame([data.min(), data.max()], index=[' Negative ideal solution ', ' Positive ideal solution '])
# distance
weight = entropyWeight(data) if weight is None else np.array(weight)
Result = data.copy()
Result[' Positive ideal solution '] = np.sqrt(((data - Z.loc[' Positive ideal solution ']) ** 2 * weight).sum(axis=1))
Result[' Negative ideal solution '] = np.sqrt(((data - Z.loc[' Negative ideal solution ']) ** 2 * weight).sum(axis=1))
# The composite score index
Result[' The composite score index '] = Result[' Negative ideal solution '] / (Result[' Negative ideal solution '] + Result[' Positive ideal solution '])
Result[' Sort '] = Result.rank(ascending=False)[' The composite score index ']
return Result, Z, weightTopsis Law The advantages of :
(1) The subjectivity of data is avoided , No objective function is required , Do not pass the test , And it can well describe the comprehensive impact of multiple impact indicators
(2) For data distribution and sample size 、 There is no strict limit on the number of indicators , It is suitable for small sample data , Also suitable for multiple evaluation units 、 Multi index large-scale system , More flexible 、 convenient
Topsis Law The shortcomings of :
(1) Data required for each indicator , It will be difficult to select the corresponding quantitative indicators
(2) The number of uncertain indicators is appropriate , To better describe the impact of indicators
(3) There must be more than two subjects to be used
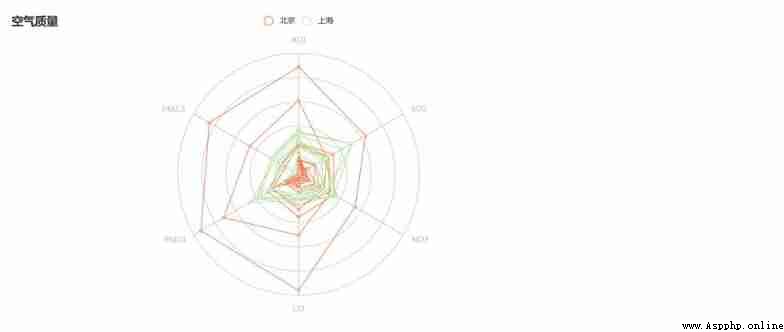
After the different indicators are normalized , And then standardize , normalization , Finally, it can be visualized , Ha ha ha , I feel a little rhymed , What about this visualization ?
Pretty good , It's a radar chart , As for how to draw a radar chart , I won't go into details here , my 《 Cool Visualization 》 The column has , Click below for details , You can jump .
Python Visual artifact for radar mapping pyecharts
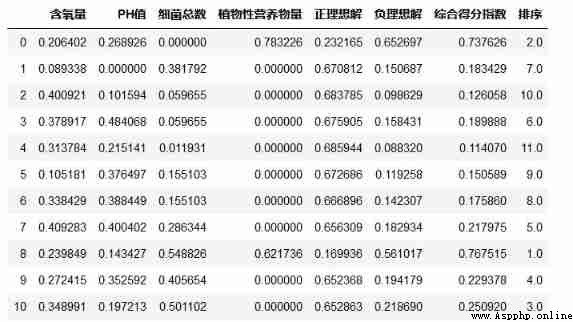
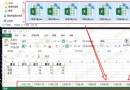
Get the above table first , In the process of Visualization
Reasonably determining the index weight is the application of TOPSIS The key to comprehensive evaluation
Evaluation results 、 The quality of the evaluation method , It has a strong subjectivity . Marxism tells us “ Specific analysis of specific problems . Under the guidance of the principle of universality of contradiction , Specifically analyze the particularity of the contradiction , And find the right way to solve the contradiction .”. How to put your thoughts in the paper 、 The principle of selecting method 、 Index selection 、 The weight structure is shown in as much detail as possible , Is the key to the successful application of the method .
Modeling , Remember not to think qualitatively all the time , We should sum up what our predecessors have done , Learn to innovate independently , To achieve real progress and promotion
Analytic hierarchy process (AHP) is a qualitative and quantitative decision analysis method , By judging the relative importance of each measurement index , Then the weight of each index in the decision-making scheme is obtained , Entropy weight method is a weight determination method based on data , The analytic hierarchy process (AHP) is a weight determination method based on experience .
Be careful : The feature vector mentioned in the analytic hierarchy process 、 Eigenvalue is not a concept in matrix , It's redefined .
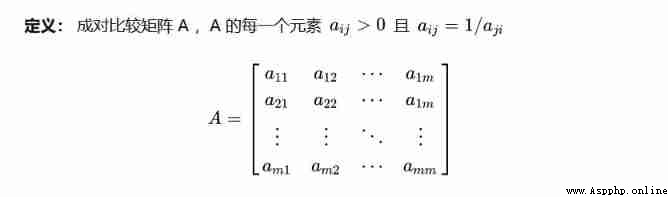
1) Construct index pairwise comparison matrix
Because qualitative determination of weight inevitably has deviation ,Santy Et al. Proposed to use the consistent matrix method , Construct pairwise comparison matrix . Co ownership M Evaluation indicators .
2) Calculate the eigenvalues and eigenvectors of the matrix
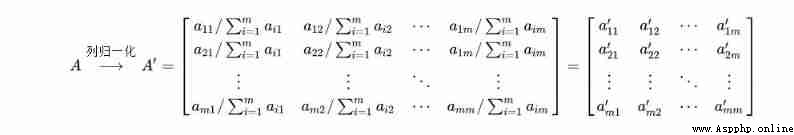
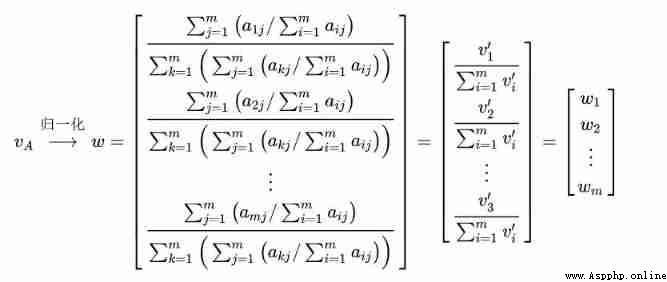
Step 1 : First, column normalization is performed on the contrast matrix , That is, each element is divided by the sum of the current column elements
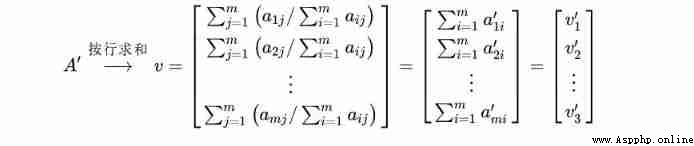
Step 2: Sum the normalized matrix in rows , Get... For each line “ Eigenvector ”
Step 3: Normalize the eigenvectors by columns , obtain “ Index weight ”
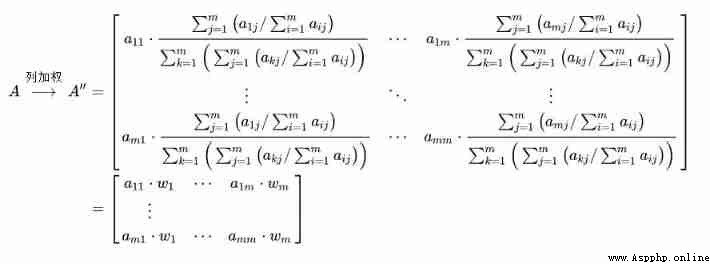
Step 4: Multiply each column of the comparison matrix by “ Index weight ” The elements at the corresponding positions in the matrix
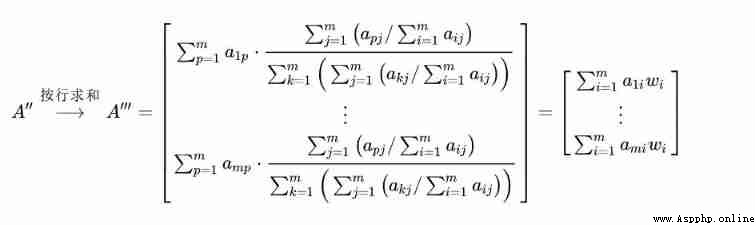
3) Judge the consistency of pairwise comparison matrix
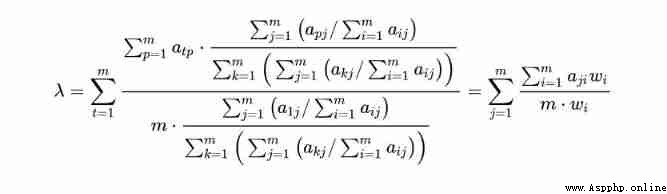
Definition : Consistency indicators CI Defined as

The closer to 0, Explain that the better the consistency , That is, the construction of the contrast matrix is reasonable . But many “ Small ” It is still an artificial choice , So introduce “ Consistency ratio ” To measure .
Definition : Consistency ratio CR, among CI Is a consistency indicator ,RI Is a random consistency index ( Look-up table is ):
This paper mainly introduces Python,Topsis Knowledge about , As for the analytic hierarchy process , The following will introduce in detail , It's just a brief mention here .
come on. !